Beyond the Jira Velocity Report: Enhancing Multi-Sprint Reporting
Jira Velocity Report: Is It Enough to Understand Sprint Performance
For agile teams practicing Scrum, tracking velocity is essential. It helps teams gauge capacity, plan future sprints, and maintain a predictable delivery pace using story points and relative estimates. Jira provides several native tools to support this, most notably the Velocity Report, Sprint Report, and Burndown Chart.
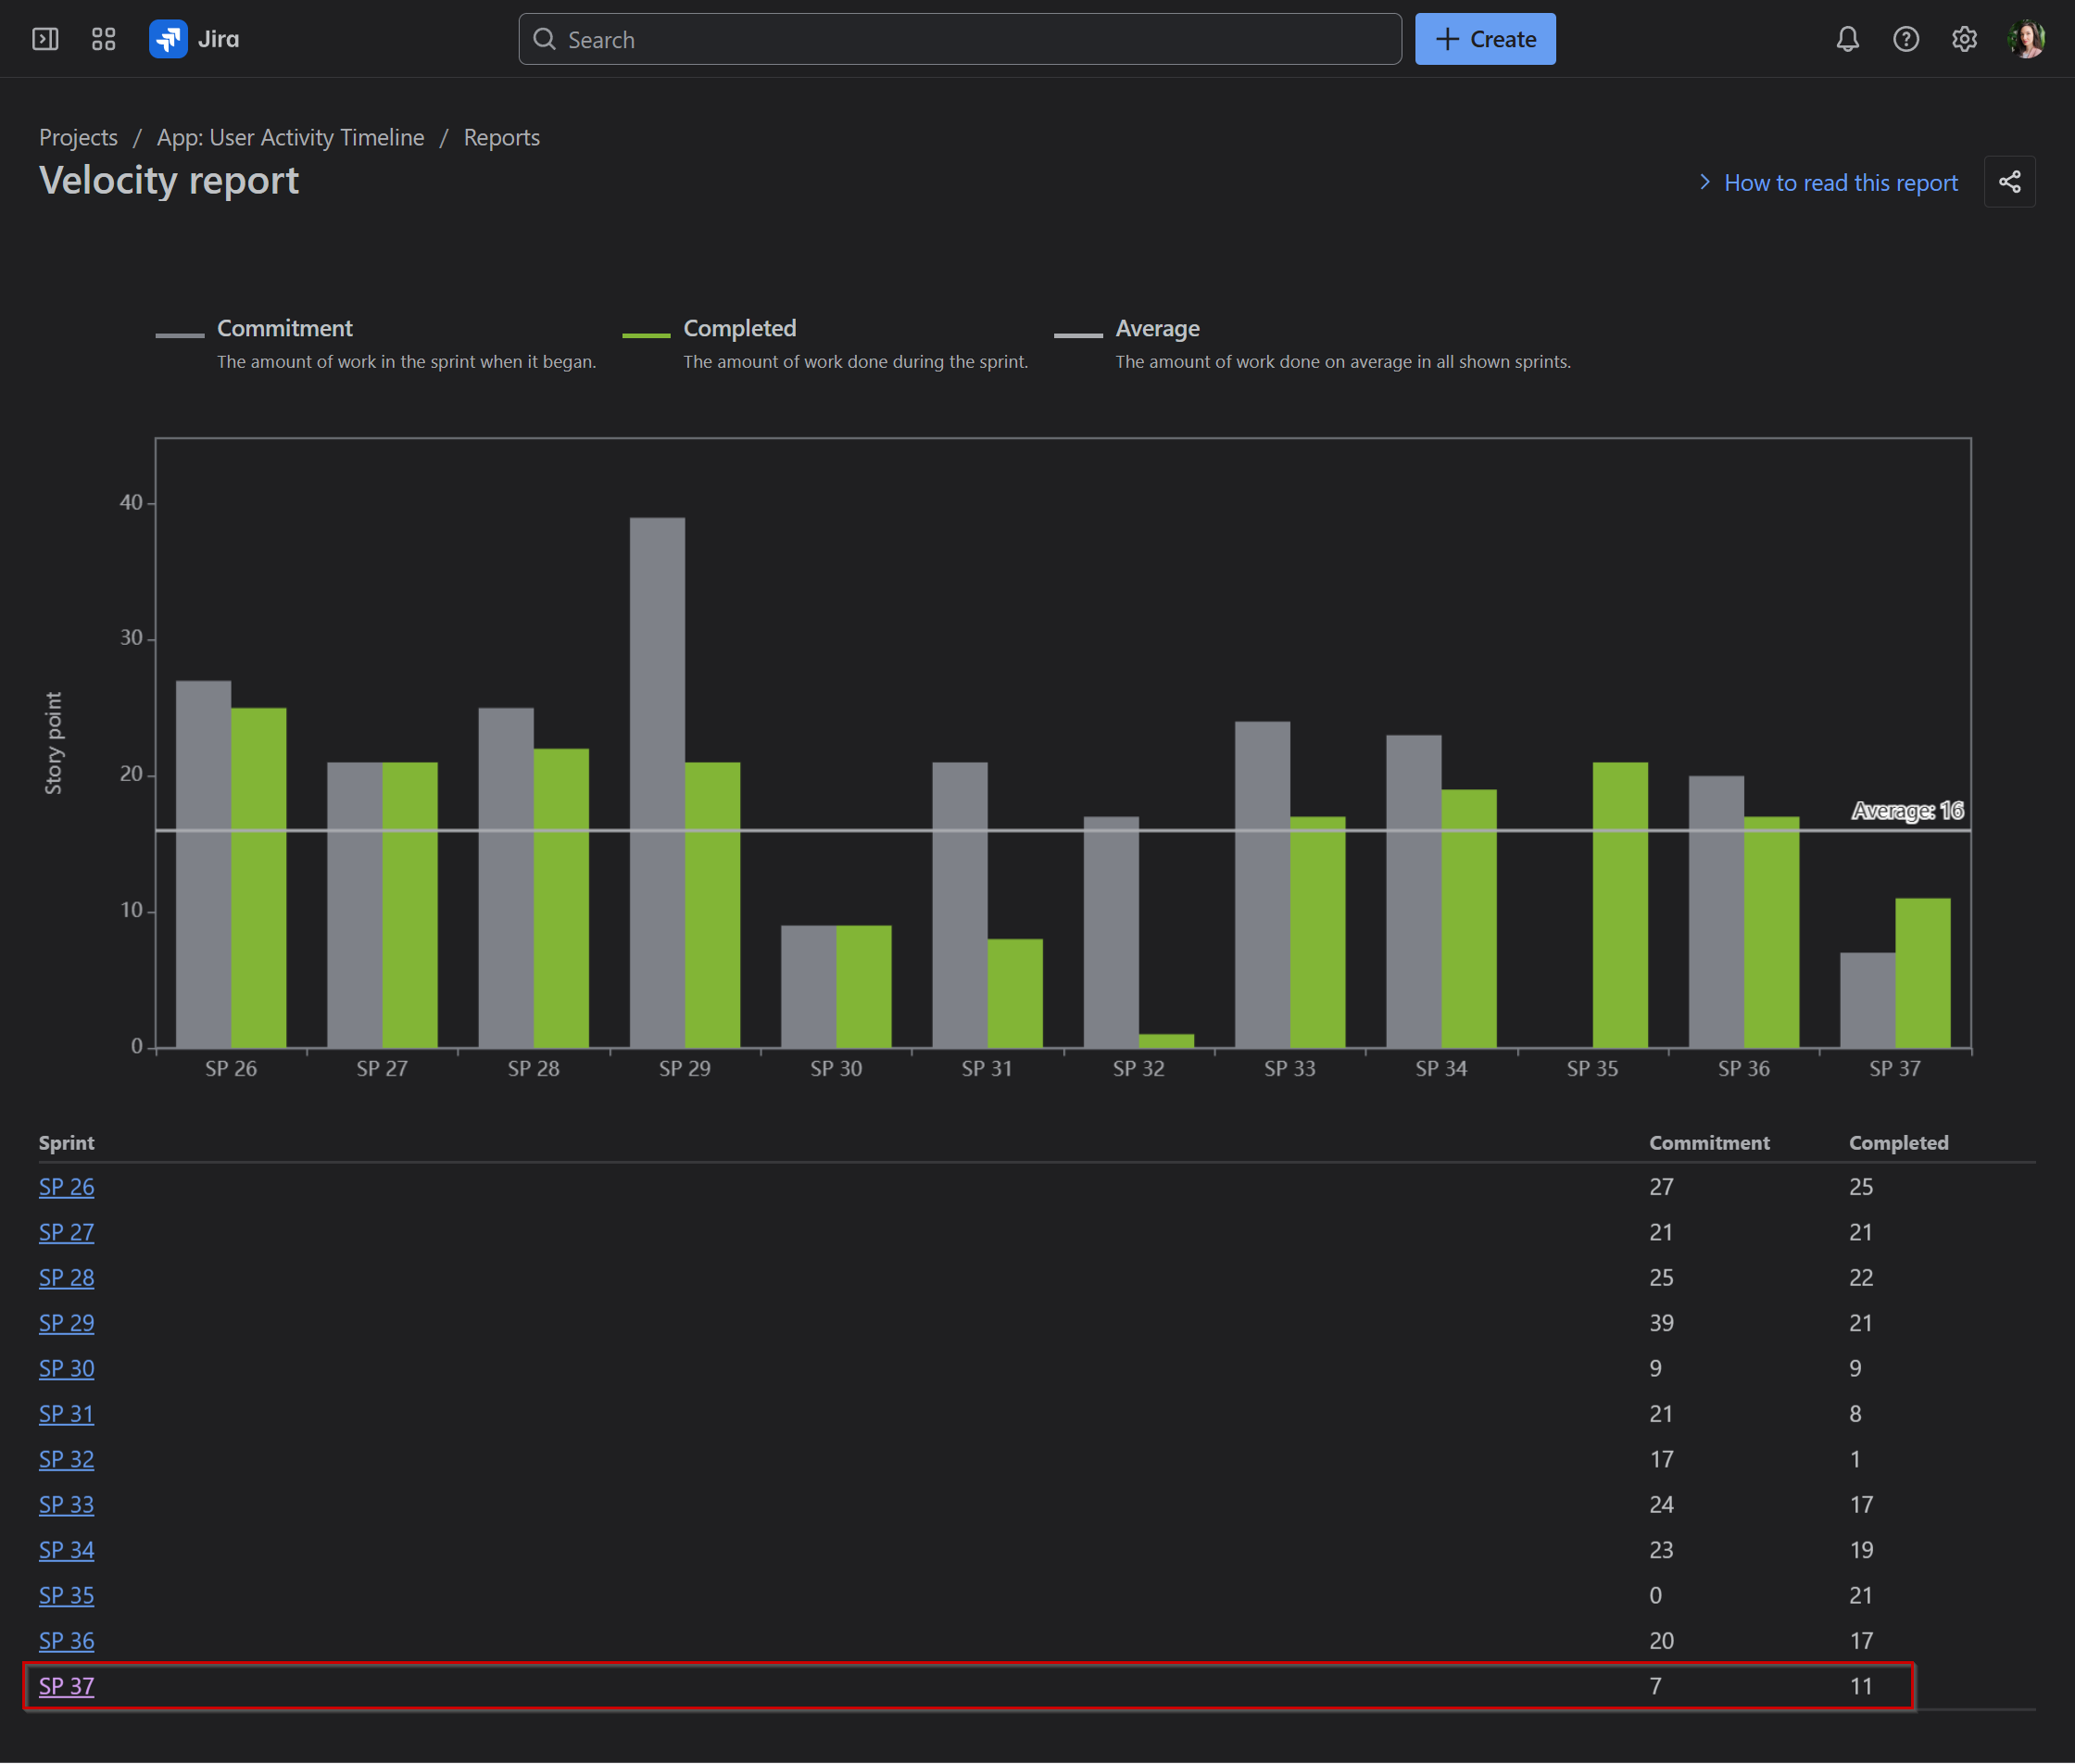
Velocity Report: Shows sprint-by-sprint commitment versus completion, along with the team’s average velocity across past sprints.
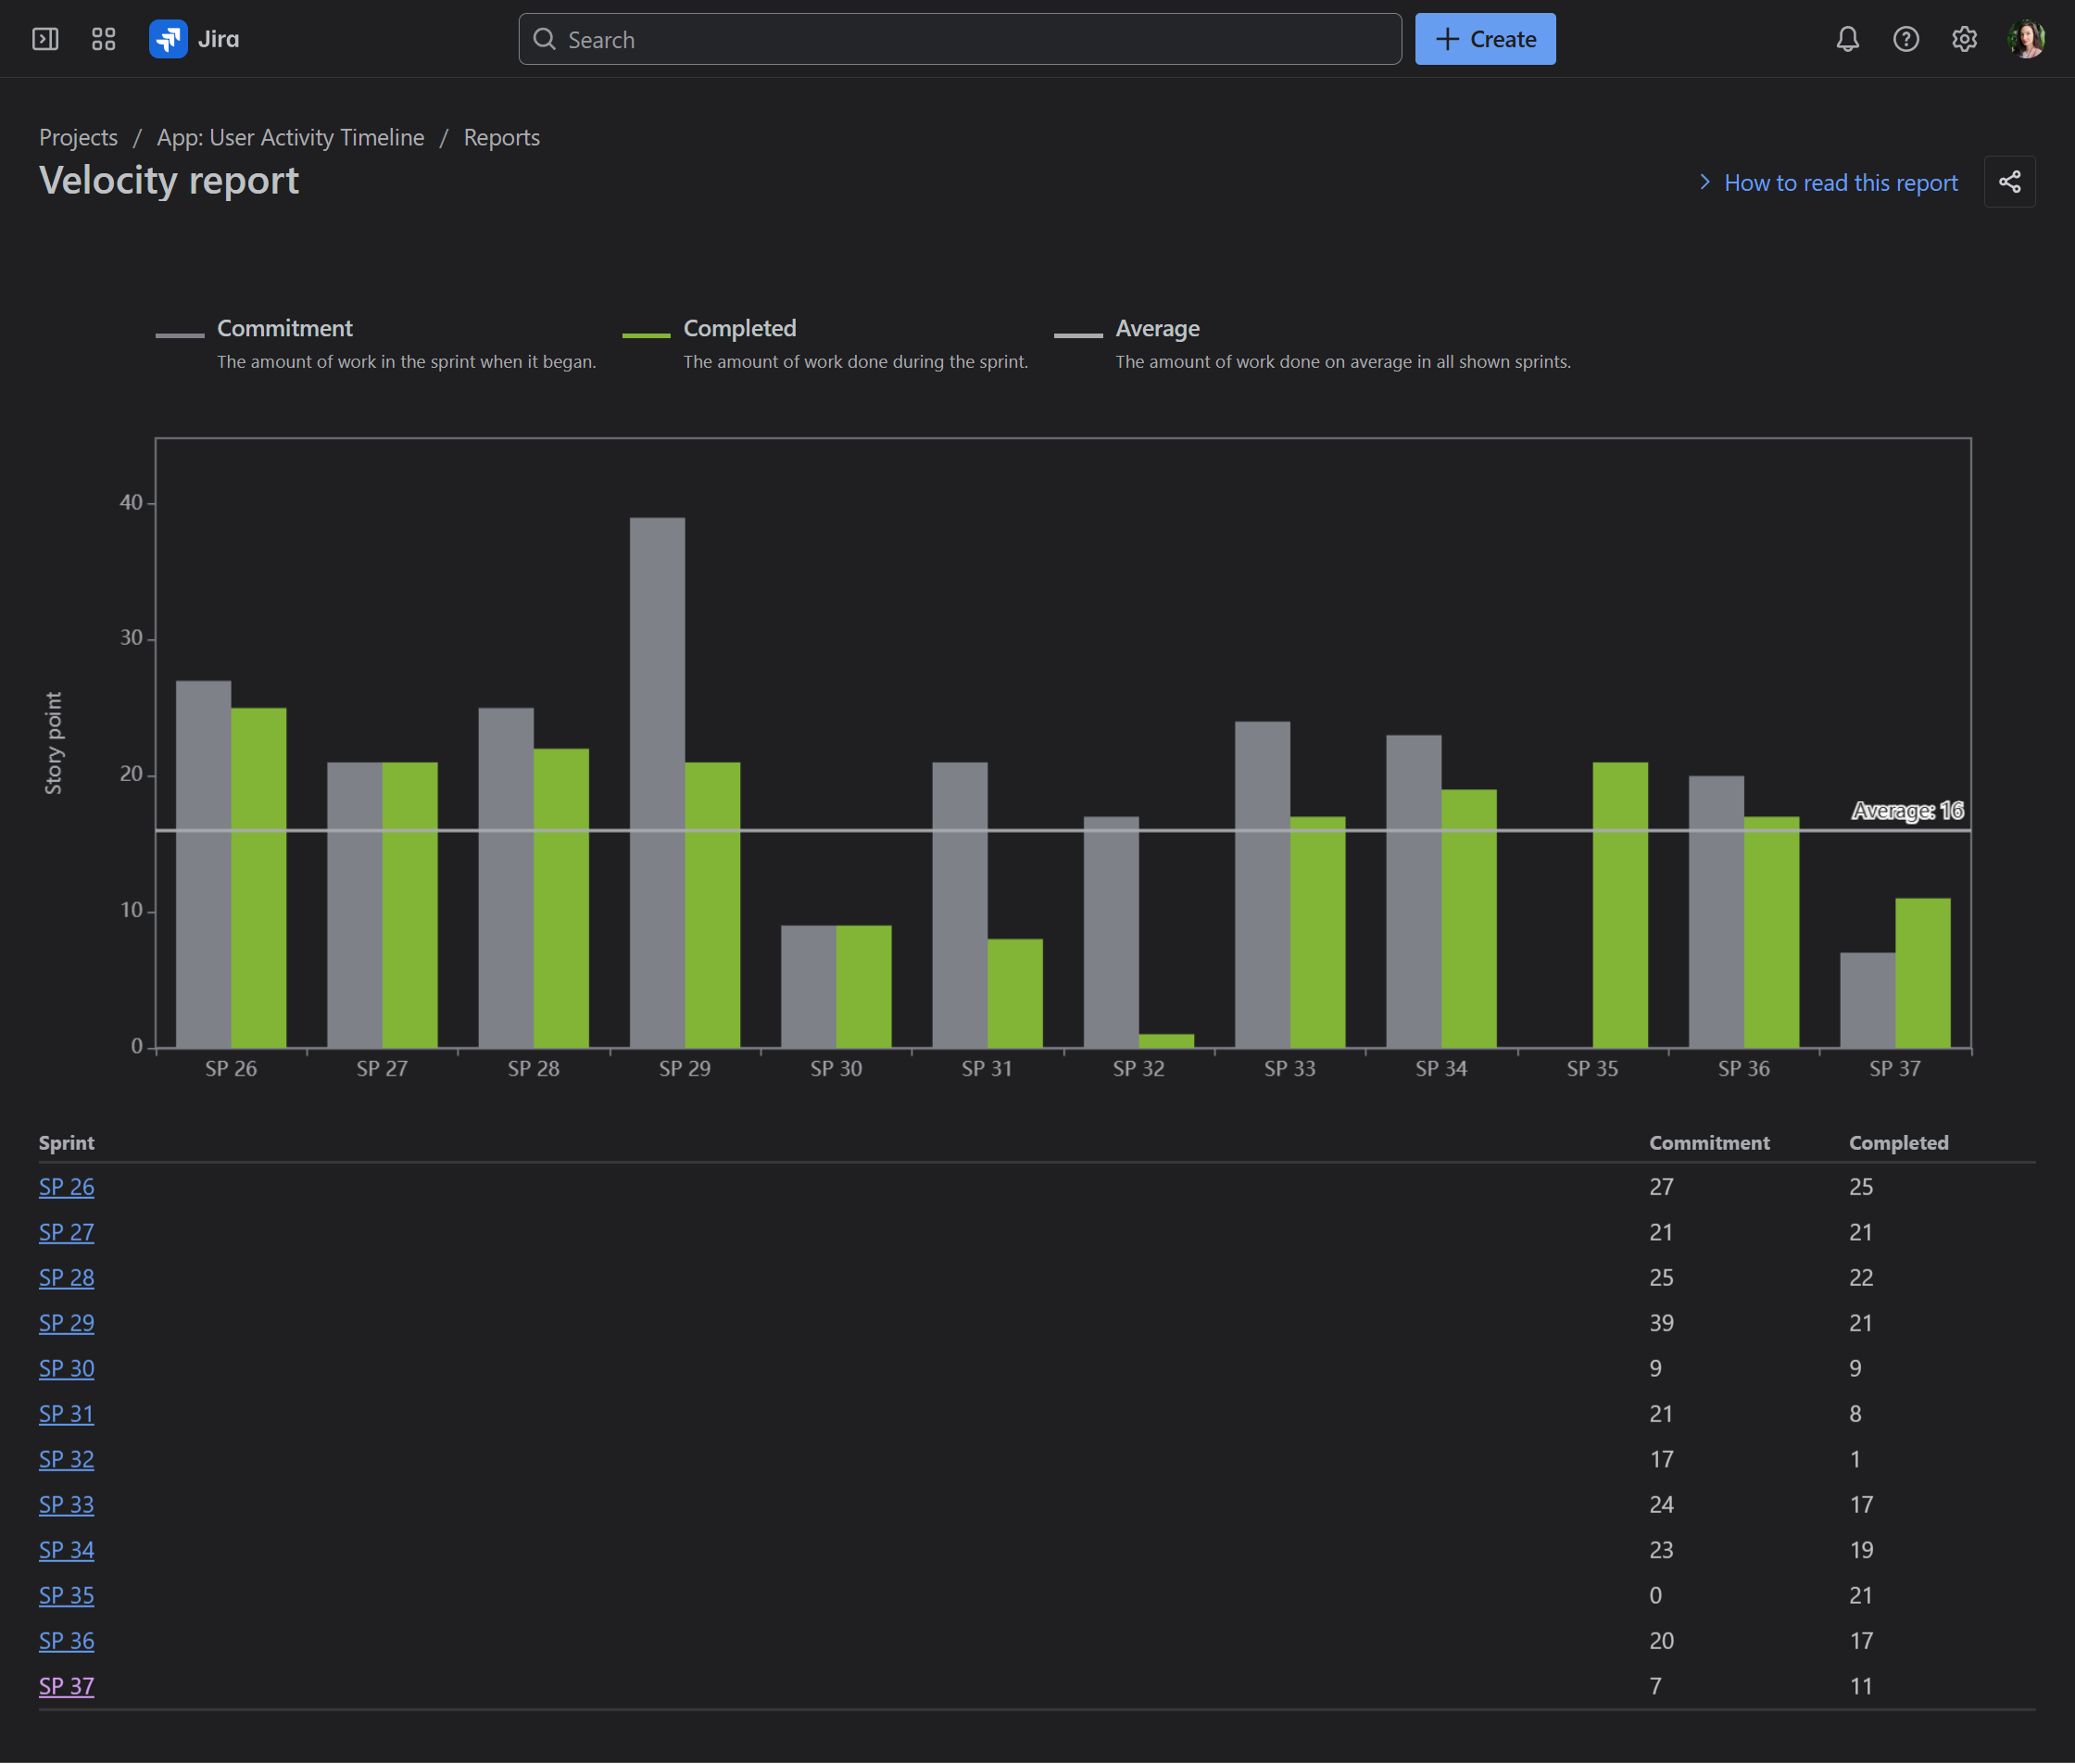
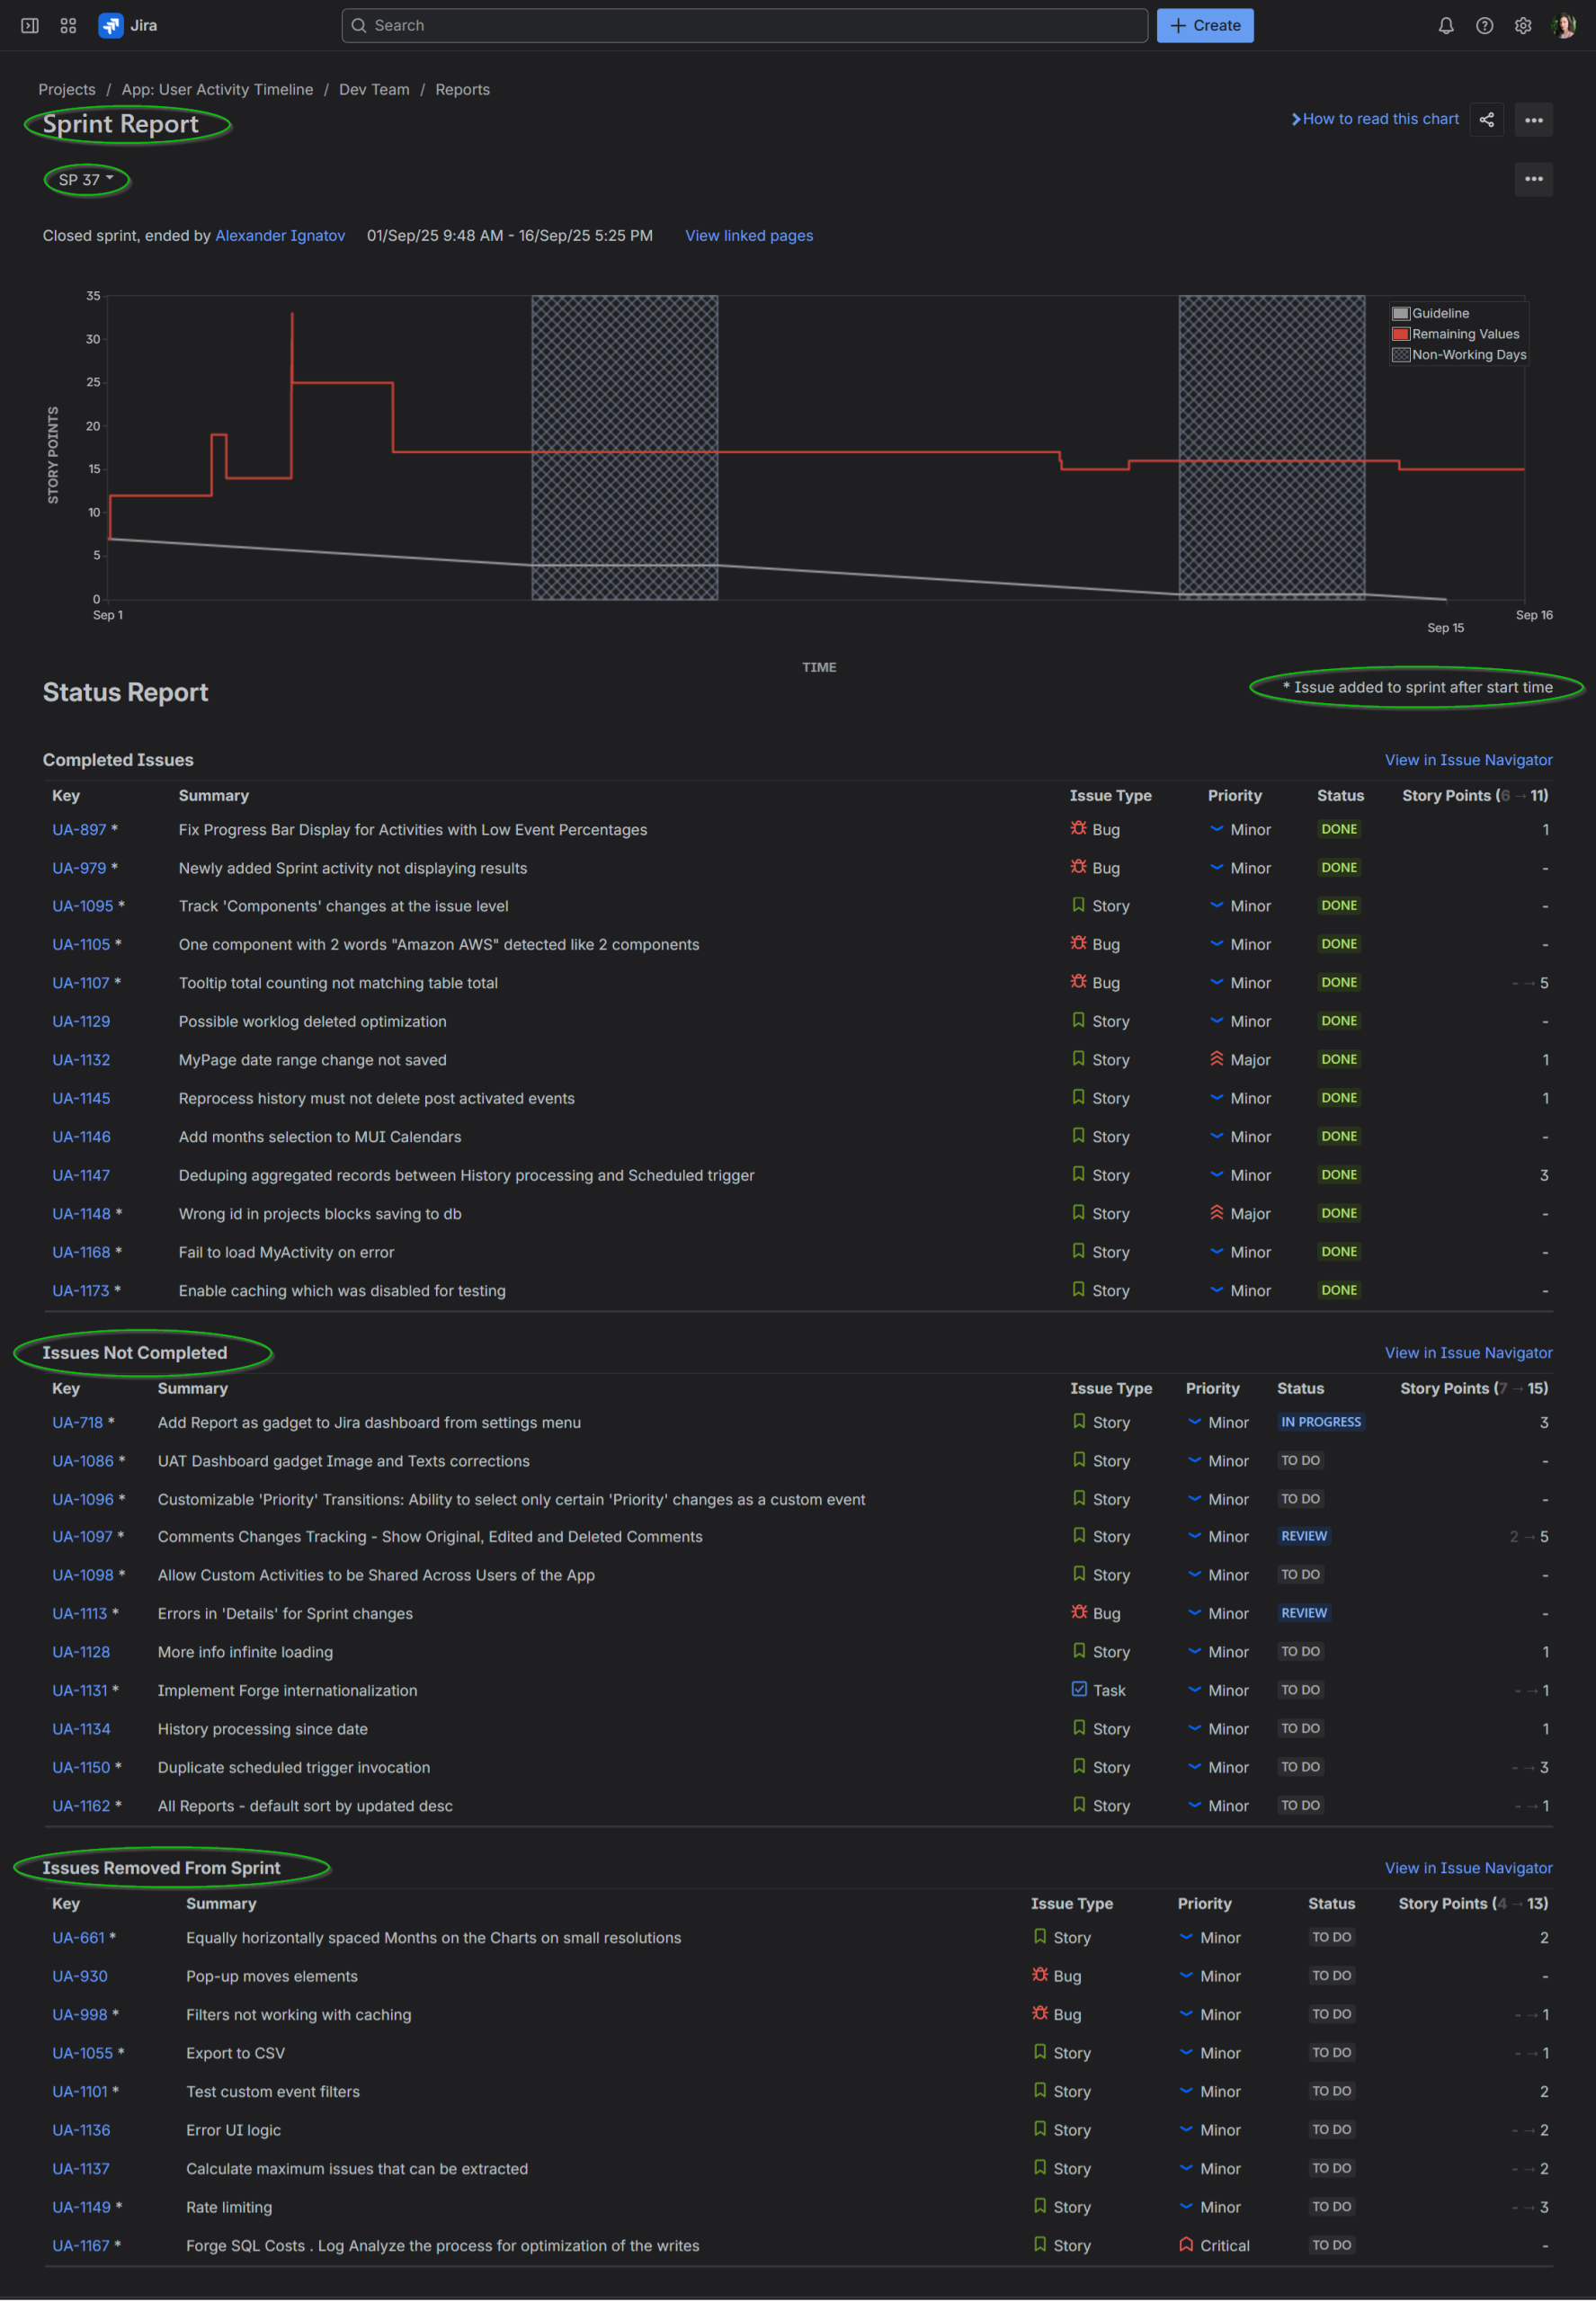
This makes it a valuable tool for predicting how much your team can commit to in future sprints, and it’s especially useful during sprint planning meetings. However, it doesn’t always tell the full story of what happened during a sprint. The report only distinguishes between “Commitment” and “Completed,” so it won’t reveal whether work was added mid-sprint or how much remained unfinished. To uncover mid-sprint changes, like scope creep, you have to switch to the Sprint Report, select only one sprint, scroll to Issues Not Completed or Issues Removed From Sprint categories, and look for items marked with an asterisk (added after the sprint began but not finished).
Sprint Report: Provides a detailed view of each sprint, highlighting completed work, items pushed back to the backlog, and changes in scope. It is essentially a comprehensive graphical and tabular breakdown of a single sprint’s journey and is particularly useful for daily progress checks and sprint retrospective meetings.
Here’s the Jira Sprint Report for SP 37. It shows single-sprint data but provides a breakdown of all work items and their story points that were completed, not completed, or removed from the sprint.
Together, the Velocity Report and Sprint Report provide useful insights, each from a different angle. One shows overall Commitment vs. Completion, while the other reveals mid-sprint changes but lacks a multi-sprint view. The Performance Objectives app bridges this gap by combining both perspectives into a single, flexible report.
Sprint Commitment State Report by the Performance Objectives App
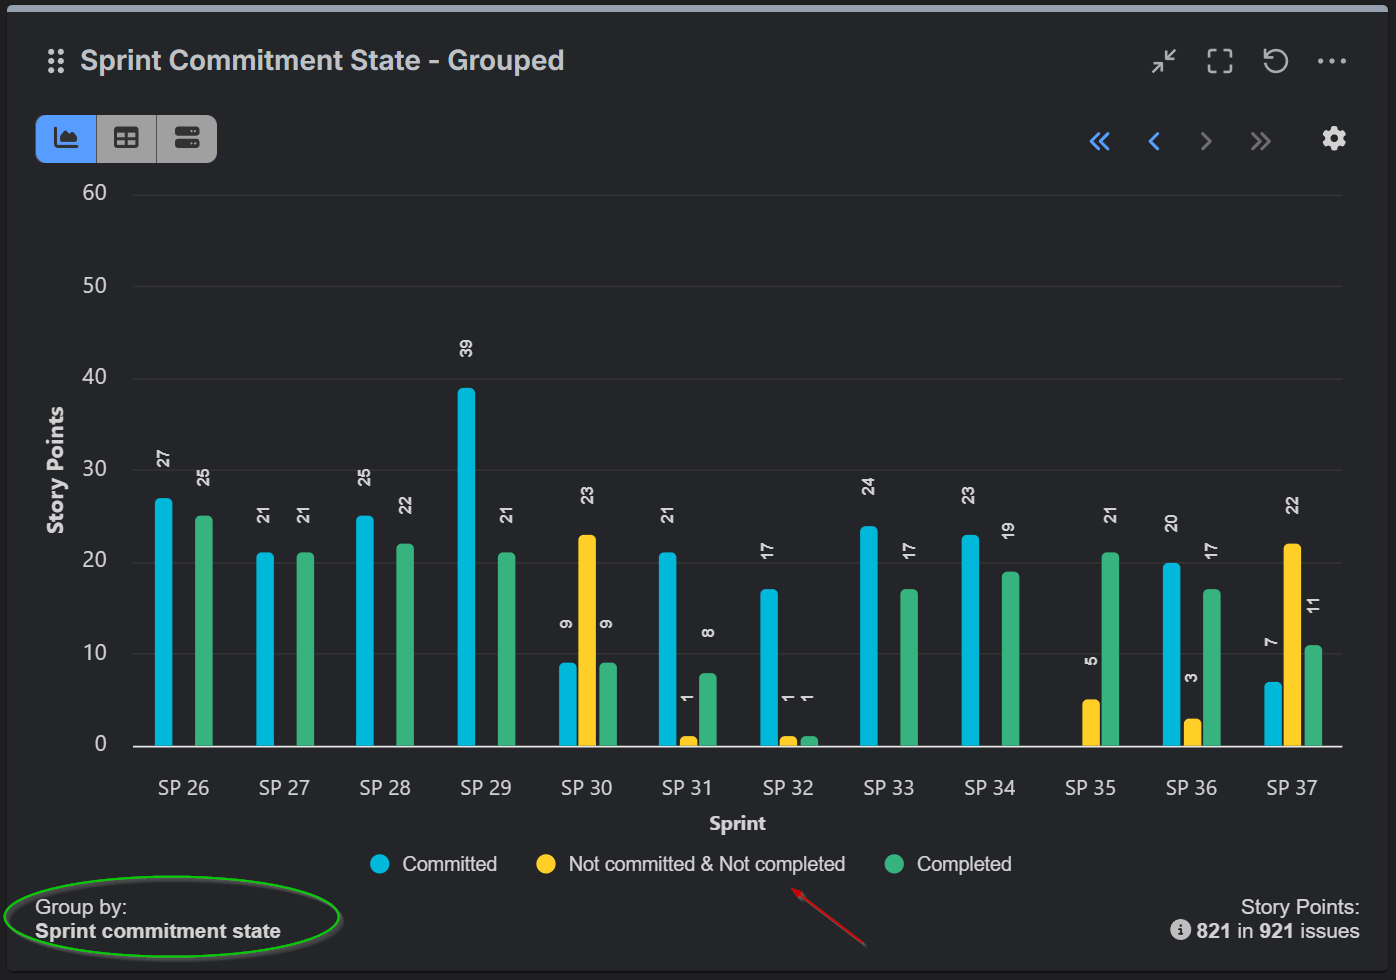
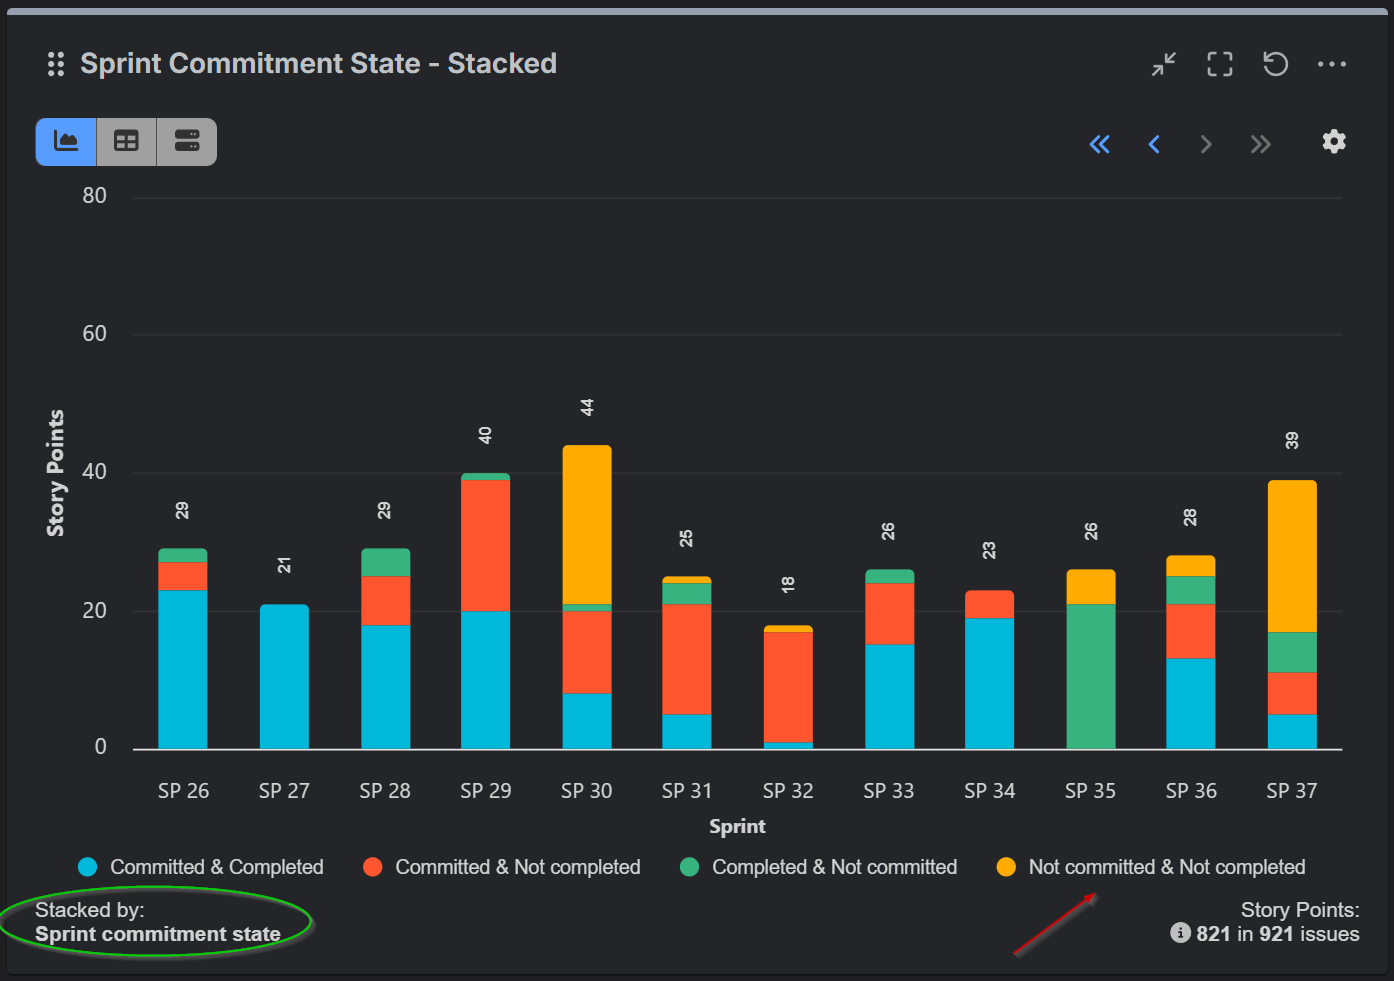
The Performance Objectives app is a flexible charting and reporting tool that enables users to select among multiple sprint-related fields and metrics for comprehensive sprint performance analysis. One of its sprint related fields is the Sprint Commitment State. When used in the Group By or Stack By options, it provides visibility into the composition of story points and work items across categories – Committed, Completed, Not Committed, and Not Completed – on a sprint-by-sprint basis within a single chart. This effectively combines the insights typically found in both the Jira Velocity Report and the Sprint Report. For a step-by-step guide on configuring this report, please refer to our Confluence documentation.
Velocity Chart vs. Sprint Commitment State Report: Why the Numbers Might Differ?
At first glance, the totals in the Jira Velocity Report may not match those in the Performance Objectives gadget. The difference lies in how work is grouped:
-
Jira Velocity Report displays two bars for each sprint: Committed and Completed. The Committed (gray) bar represents the total estimate of work at the start of the sprint. Items added later, or estimate changes during the sprint, are not included. The Completed (green) bar represents the total estimate of work actually completed by the end of the sprint, including scope changes made after the sprint began.
-
Sprint Commitment State field in the Performance Objectives app adds an additional category: Not Committed & Not Completed (unplanned work added mid-sprint but unfinished).
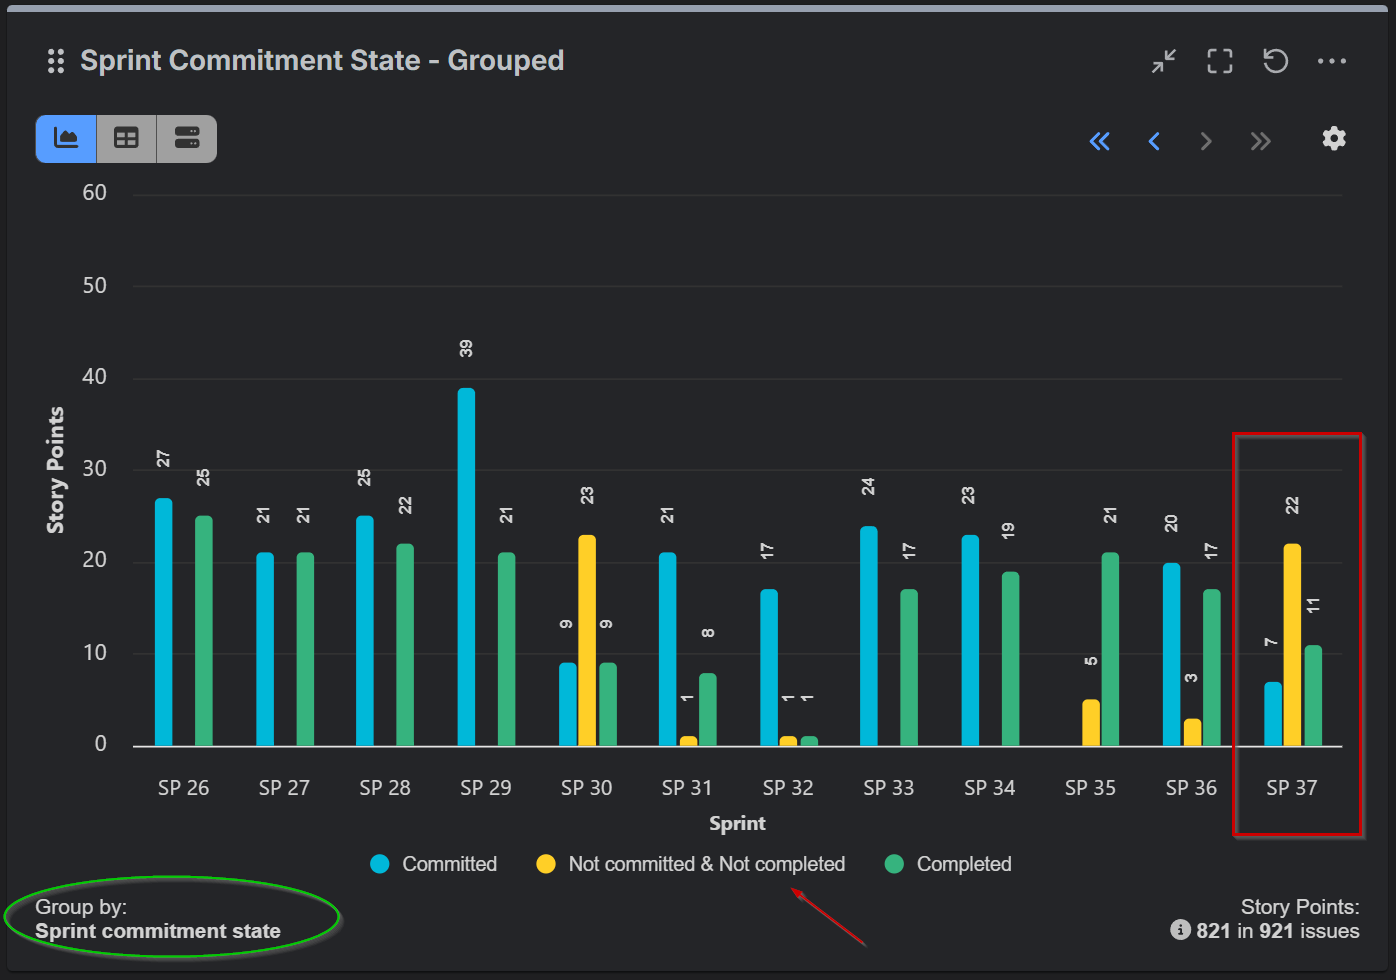
To reconcile the numbers directly, you can temporarily hide the “Not Committed & Not Completed” category in your gadget. When you do, the view will align with Jira’s Velocity Report.
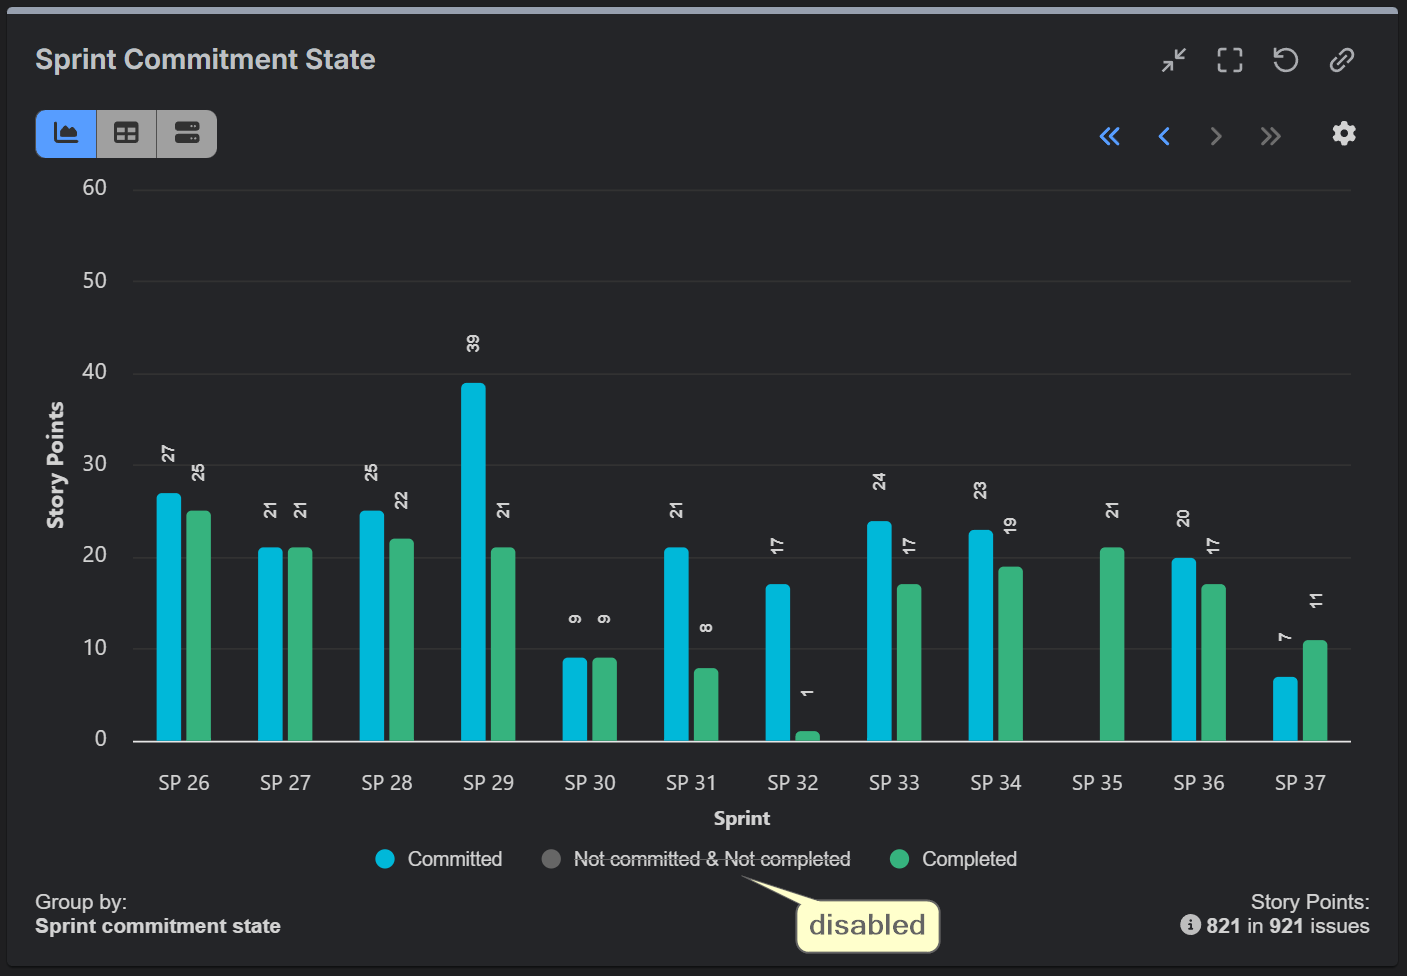
However, excluding it removes valuable context. Unplanned work has a real impact on the team’s ability to meet sprint goals. Seeing it clearly, sprint after sprint, helps teams spot patterns of scope creep and have more informed discussions about improving planning accuracy.
Without this enhanced view, you’d need to dig into Jira’s Sprint Report: select a sprint, scroll down to Issues Not Completed, and manually locate the items marked with an asterisk (*) – those added after the sprint started. The Performance Objectives app brings all this information together in one convenient, multi-sprint chart on your Jira dashboard, where you can also complement it with other sprint-related reports for a more comprehensive view of sprint performance.
Explore More Multi-Sprint Reports
The Sprint Commitment State report is just one example of how the Performance Objectives app can enhance your multi-sprint reporting. If you’re looking to gain deeper insights into your team’s delivery, explore the other sprint-related reports in our library, such as the Agile Team Velocity KPI report, Personal Velocity KPI report, Say-Do Ratio, Sprint Rollover Ratio, and more. You can try the Performance Objectives app for yourself with a 30-day free trail by visiting the Atlassian Marketplace.