Beyond Basic Bug Tracking: 4+ Reports for Advanced Jira Defect Management
In software development, effective defect management is not just a best practice, it’s a necessity for delivering high-quality products. For many teams, Jira is the platform of choice for project management, and it excels as a robust issue tracking tool. However, its native reporting features are not specifically tailored to bug reporting. This article will explore how to master Jira defect management and, more importantly, how to gain actionable insights through a powerful reporting dashboard configured with the Performance Objectives app.
Why Jira Can Be a Game-Changer for Defect Management
Jira has become the #1 agile project management tool for a reason. Its flexibility and rich feature set provide a good foundation for your Jira defect management process, making it an ideal choice for bug tracking teams. Here’s a quick look at some of its most valuable features for defect management:
- Customizable Workflows: It allows you to create a customizable workflow, which is the backbone of any successful Jira defect management process. From “To Do” to “In Progress,” “In Review,” and “Done,” you can define the stages that make sense for your software development lifecycle.
- Detailed Issue Tracking: With Jira, you can capture details, including priority, severity, affected versions, components, and environment. You can add custom fields to tailor the information to your specific needs.
- Strong Integrations: Extend the power of Jira by integrating it with your development tools like GitHub, Bitbucket, or Slack for communication. This creates a unified ecosystem where information flows seamlessly, from code commits to bug reports.
- Advanced Search with JQL: Even though it has its own limitations, Jira Query Language (JQL) is a great tool that allows you to create highly specific searches. This is invaluable for finding the exact issues you’re looking for, whether it’s by assignee, status, or any other field.
- Seamless Collaboration: Jira fosters collaboration between developers, QA engineers, and product managers. Team members can comment on issues, add mentions to colleagues, and share attachments, ensuring everyone is on the same page.
Are Native Reports Enough for Effective Jira Defect Management?
While tracking bugs is essential, an effective Jira defect management strategy comes from understanding the data behind your process. This is where reporting dashboards come in. By visualizing your defect data, you can identify trends, spot bottlenecks, and make data-driven decisions to improve your team’s efficiency and the quality of your product.
However, Jira is not designed as an advanced reporting tool. It provides built-in reports and dashboard gadgets, but teams aiming for in-depth quality analysis often encounter its limitations:
- Project-Siloed Reporting: Native reports are typically restricted to a single project. This makes it difficult to track defects across multiple teams or view bugs at a portfolio level.
- Limited Filtering: You can’t dynamically filter native reports by issue type (e.g., only show “Bugs”) or by custom fields like severity or root cause. This usually requires creating and saving custom JQL filters in advance.
- Rigid Visualization Options: Chart types are basic and not highly customizable. You can’t change chart colors or labels, merge multiple data sets, or create multi-dimensional views (e.g., bugs by severity and component)
- No Support for Deep Analysis: There’s no way to perform custom calculations (e.g., defect severity index), view historical trends by week, sprint, or release, analyze linked issues (e.g., bugs per epic or fix version, etc.)
For advanced reporting, many teams turn to apps like the Performance Objectives app for Jira, which allows you to create comprehensive and interactive dashboards. Let’s explore some key reports you can build.
Actionable Insights with Jira Dashboards: Report Examples
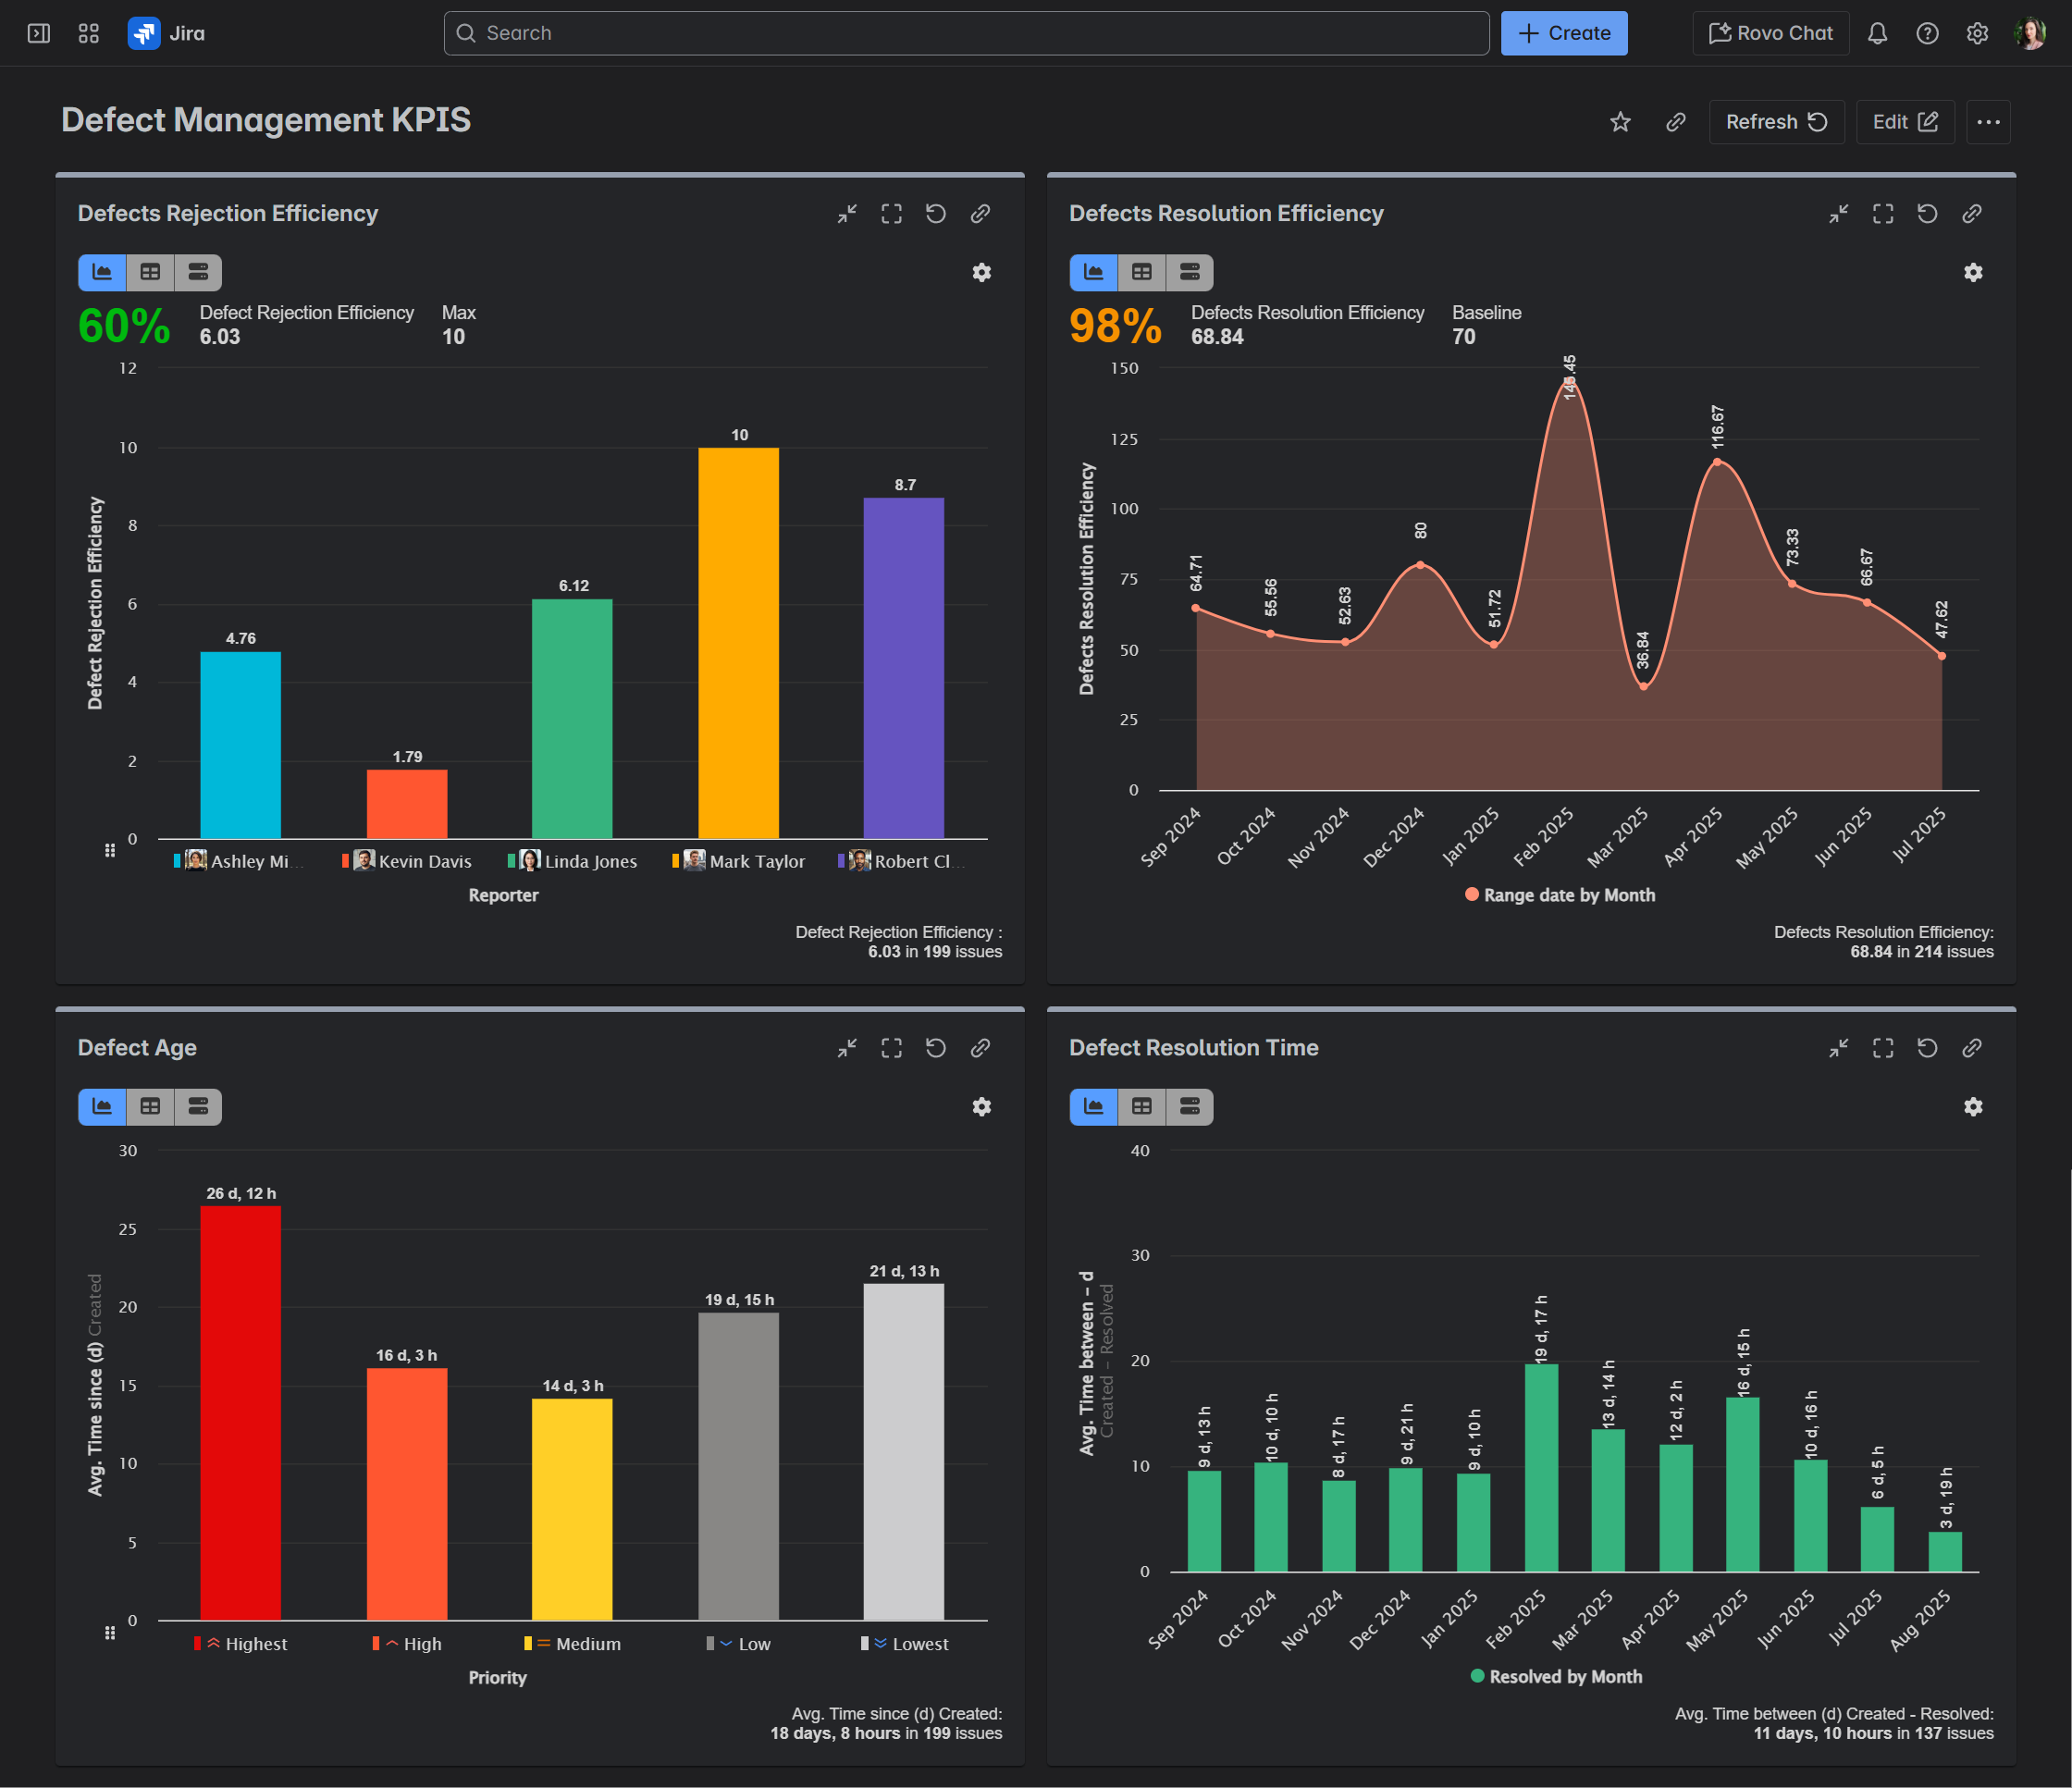
Here are some examples of reports for Jira you can configure with our app to supercharge your Jira defect management process:
Defects Rejection Efficiency
This report tracks the percentage of defects rejected by the development team (i.e., invalid bugs) relative to the total number of reported bugs. A high rejection rate can signal several underlying issues, such as:
- Vague or incomplete bug reports: Testers may not be providing enough information for developers to reproduce the issue.
- Misunderstanding of requirements: There might be a disconnect between the development and QA teams about how a feature should work.
- Environmental differences: The bug may only be reproducible in a specific environment.
By monitoring this metric – and even setting a maximum benchmark for it directly in your Jira dashboard – you can gain early warning signs of potential issues, uncover actionable insights, and take proactive steps to improve the quality of bug reports and foster better communication between teams.
Defects Resolution Efficiency
This report measures the percentage of defects that are successfully fixed and verified (i.e., resolved versus created bugs). In our example, it is displayed monthly over a one-year period, but you can configure it for any time frame that suits your needs. A baseline has also been added to help assess this metric more effectively. High resolution efficiency is a strong indicator of a healthy and productive development process.
Defect Age
Tracking the average age of bugs in Jira provides valuable insights into the health of your project and the efficiency of your team. This metric goes beyond simple bug counts and helps you:
- Identify Process Bottlenecks: A high average bug age can indicate bottlenecks in your workflow. For example, if bug age is increasing, check whether issues are spending too much time in a “To Do” or “Waiting for QA” status (‘Time in status’ reporting is also available in the Performance Objectives app). This may indicate problems with prioritization or resource allocation at specific stages of the development cycle.
- Reveal Prioritization Gaps: By analyzing bug age filtered by priority, you can quickly identify whether high-priority or critical bugs are being overlooked.
- Serve as a Key Performance Indicator (KPI): Average bug age is a simple yet powerful KPI that reflects a team’s responsiveness and efficiency. A decreasing trend shows improvement in addressing issues promptly, while an increasing trend suggests that the backlog may be growing faster than it can be managed.
- Improve Product Quality: The longer a bug remains unresolved, the higher the risk it will impact users or interfere with ongoing development. Reducing average bug age helps teams deliver a more stable and reliable product, leading to higher customer satisfaction.
- Enhance Stakeholder Reporting: this metric provides a clear, meaningful way to communicate progress. Instead of just reporting bug counts, you can say, for example: “The average age of open bugs has been reduced by 20% this quarter”, offering stakeholders a more tangible measure of performance improvement.
Defect Resolution Time
Similar to Defect Age, you can create a Defect Resolution Time report to track the average time it takes to resolve bugs over a specific period. This report helps set realistic expectations with stakeholders. By grouping the data by a relevant field – such as Assignee, Priority, or Components – you can gain additional insights and identify areas where your team can improve its efficiency.
Expand Your Bug Reporting Arsenal
The reports mentioned above are just the beginning. To get a truly comprehensive view of your Jira defect management process, consider tracking these additional KPIs:
- Defects Severity Index: This report helps you understand the overall risk and impact of the defects in your backlog by assigning a weighted score to each bug based on its severity.
- Punctuality of Reported Defects: The goal of this report is to help identify and analyze false-positive cases reported by the QA team, enabling you to reduce their occurrence over time.
- % High Severity Defects Report: You may use this report as a health indicator for product quality over time. An increasing trend may signal emerging quality issues that need investigation.
- Defect Removal Efficiency: This report measures your team’s ability to find and fix defects before they reach production, which is a key indicator of your overall software quality.
- Bugs Month over Month: Track the number of bugs created period-over-period to analyze trends, assess the impact of releases, and evaluate process changes.
- Bugs Missed by Engineering: This KPI is important because bugs, defects or other problems in a software application reported by non-engineering teams could indicate issues that directly impact end-users and potentially lead to lower customer satisfaction.
- Defects Leakage per Project: Calculate the percentage of bugs reported by the QA team versus those reported by others using a formula. Track defect leakage to monitor how many bugs slip through to production compared to a target maximum percentage, helping identify areas for process improvement.
- Defects vs Features Ratio: Track the balance between feature development and defect resolution, providing insights into product quality and development focus.
- Time Spent in Rework: Measures the proportion of total development time dedicated to fixing bugs versus working on new features, helping teams understand and manage the impact of rework on overall productivity.
- Root Cause Analysis Report: Displays issues categorized by the custom ‘Root Cause’ field, helping teams identify and analyze recurring problems and their underlying causes.
Conclusion
By configuring insightful reporting dashboards in Jira with apps like the Performance Objectives, you can move beyond simple bug tracking and gain a deep understanding of your team’s performance. The reports and KPIs discussed in this article will allow you to identify areas for improvement and ultimately deliver a higher-quality product to your clients.


