Performance Objectives
Charts and Reports for Jira
User Activity Timeline
Jira Activity Reports
Jira KPI Examples
A library of insightful KPI Reports for your Jira Dashboards
Solutions for Every Team and Need
Software Development
Service Management
Misc KPIs
Time Tracking
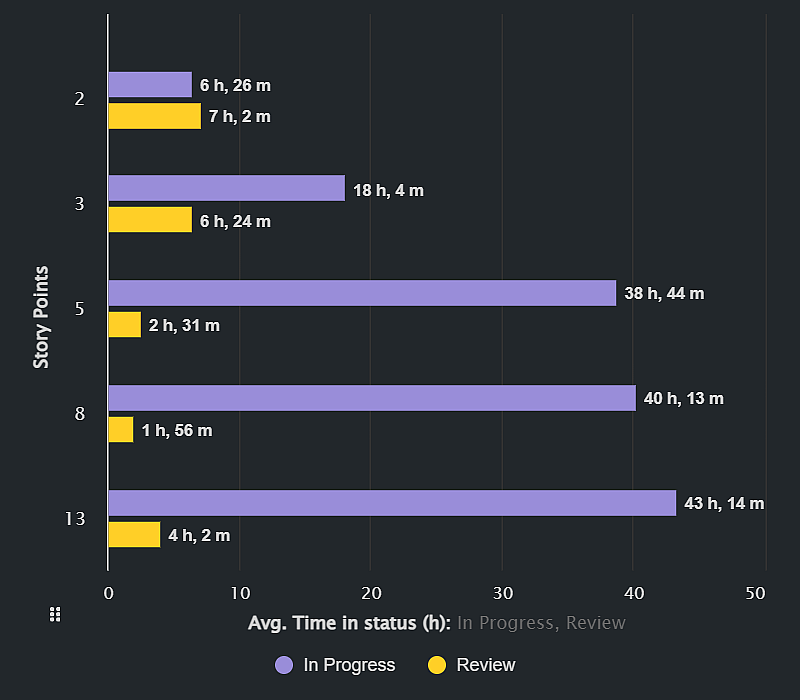
Complexity vs Performance KPI
Continue reading
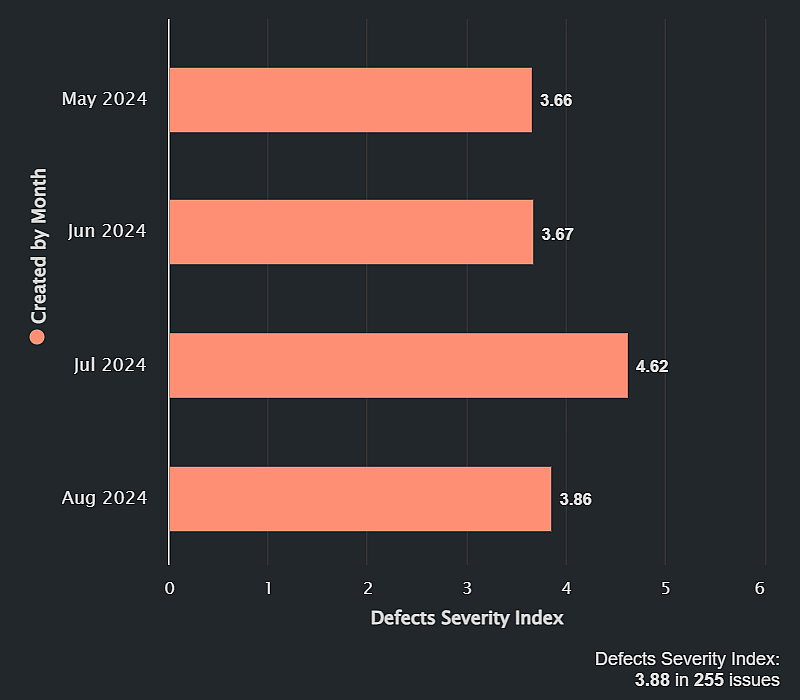
Defects Severity Index
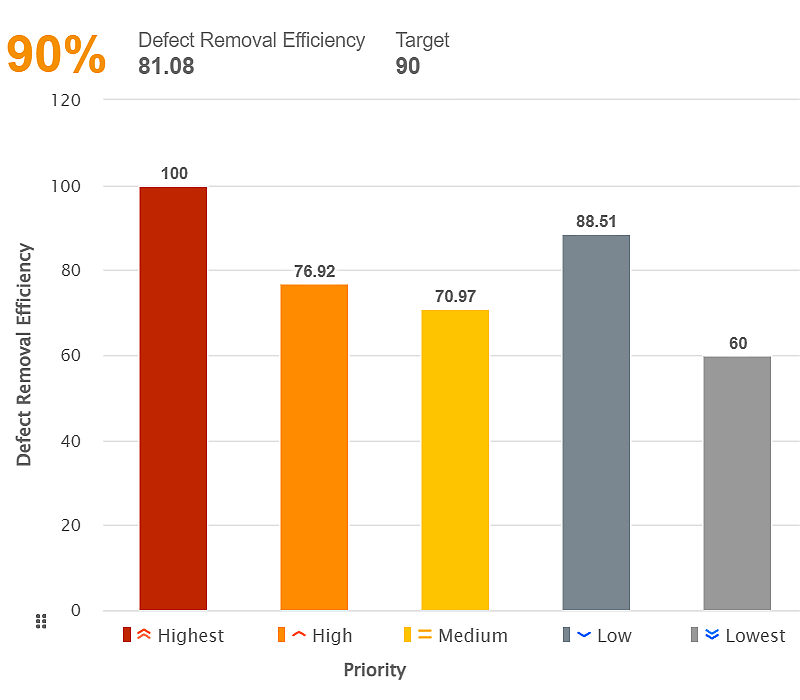
Defect Removal Efficiency (DRE)
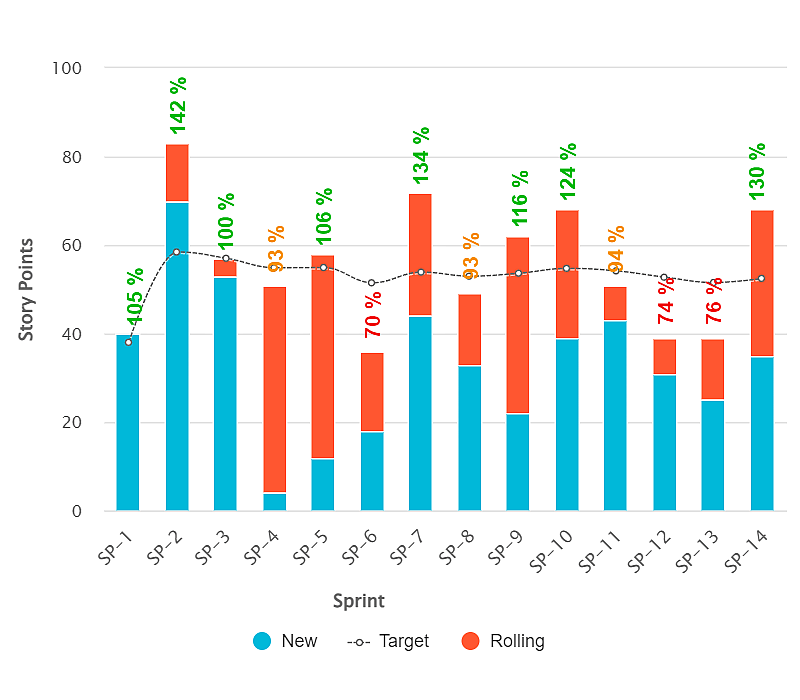
Agile Team Velocity
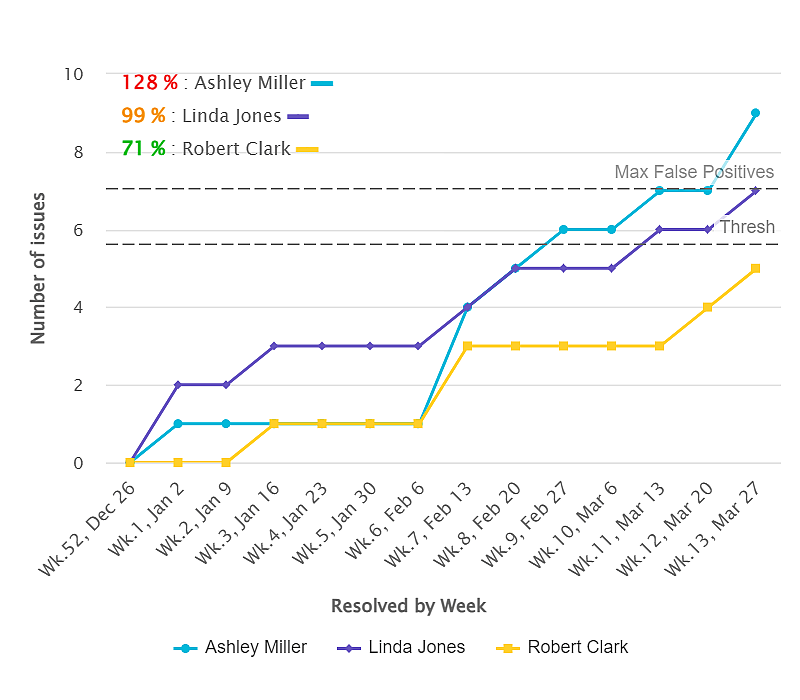
Punctuality of Reported Defects
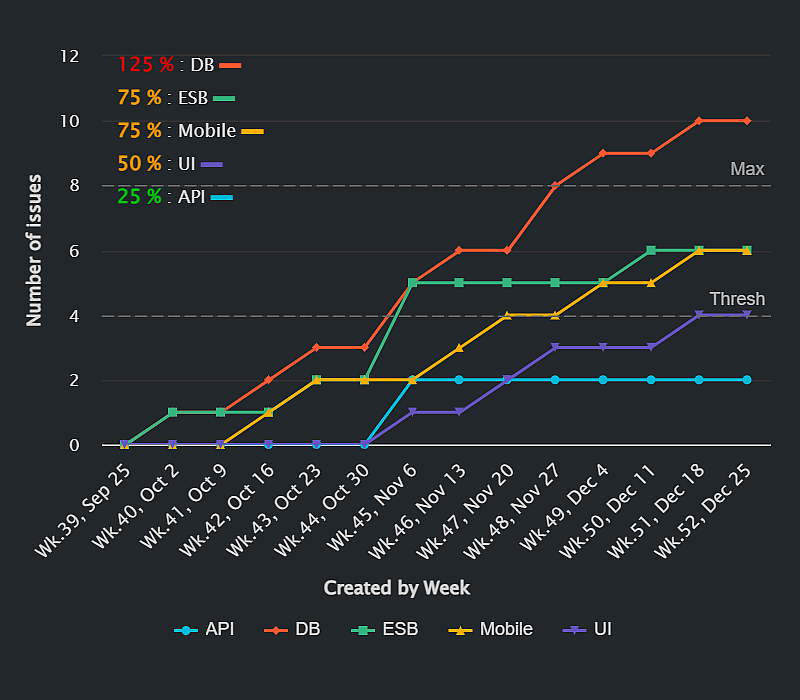
Bugs Missed by Engineering
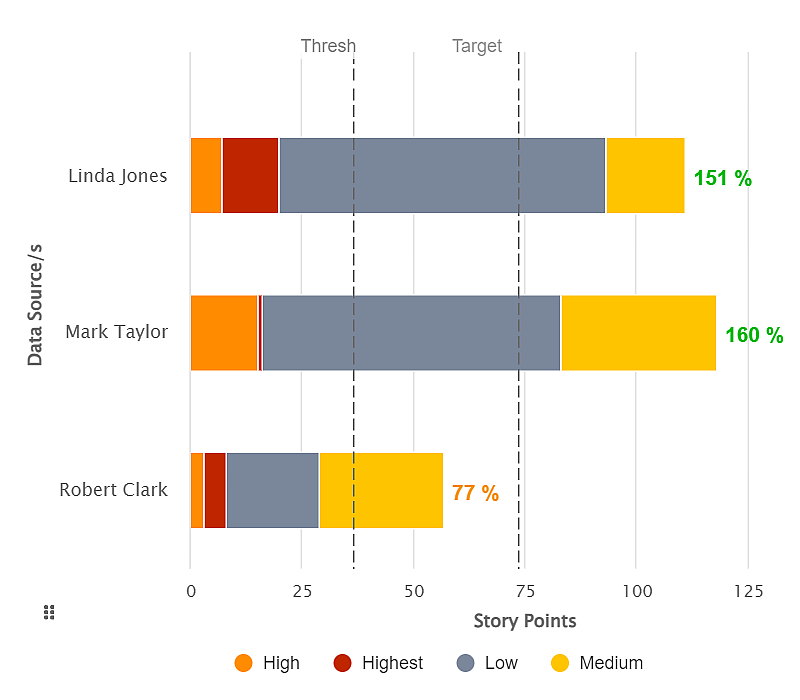
% of Total Story Points KPI
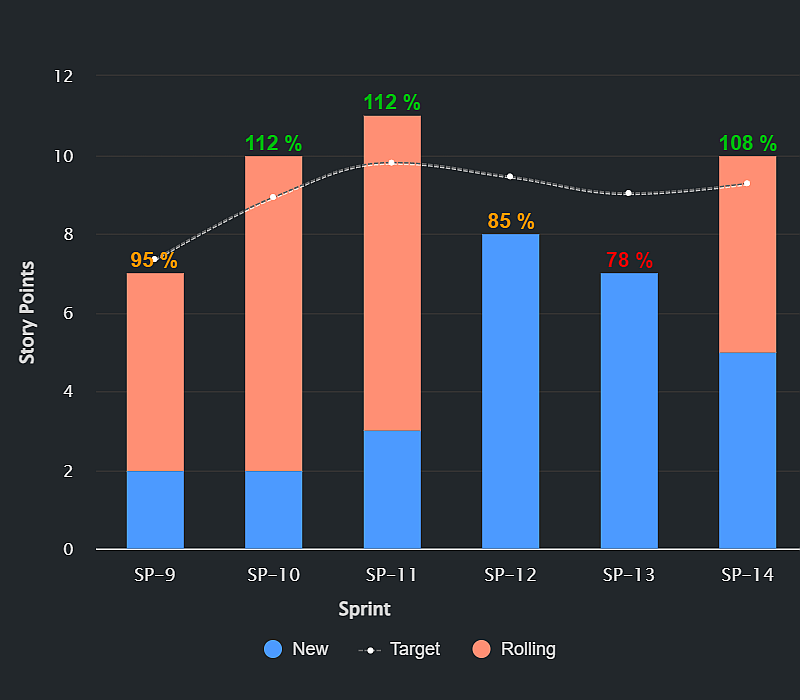
Personal Velocity KPI
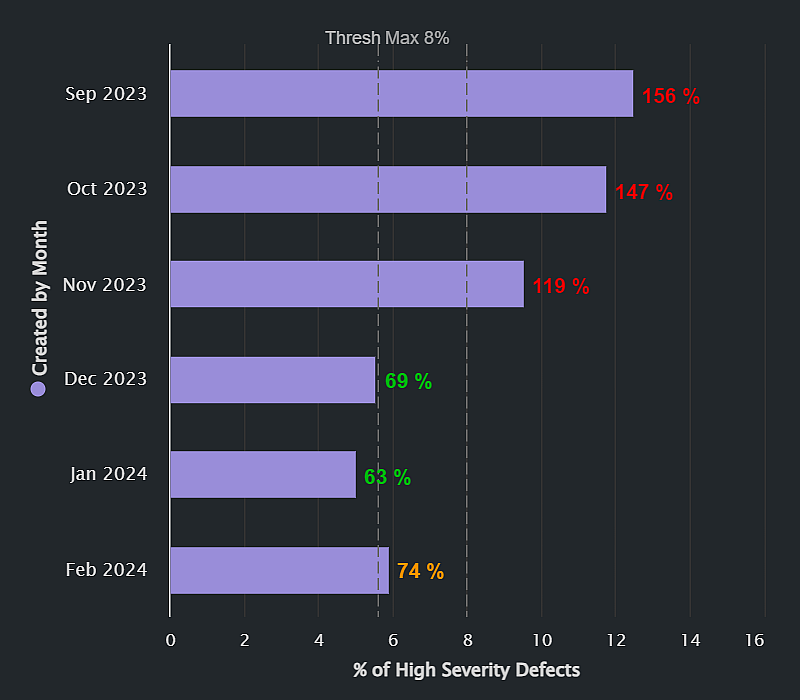
% of High Severity Defects