Kanban Throughput – Moving Average
The Performance Objectives: Charts and Reports for Jira app provides a distinctive and valuable calculation option called Moving Average (MA), which can serve as a powerful basis for target setting. By enabling targets to be defined as a percentage of the Moving Average, this option allows dynamic goal-setting – based on the current metric or a different, contextually relevant one – and can be highly effective, especially in dynamic or evolving teams. In this article, we will explore how MA can be used as a target baseline in the Kanban Throughput report, and how it helps tracking long-term objectives and uncover performance trends.
Using Moving Average as a KPI:
The Moving Average option for target calculation is available in both the Performance Objectives and Performance Trend dashboard gadgets.
A Moving Average smooths out fluctuations in data by calculating the average of throughput over a set number of recent periods (e.g., the past 4 weeks). As new data comes in, the average “moves” forward.
By setting targets as a percentage of the Moving Average, you can gain valuable insights into overall trends and determine whether there is a consistent improvement or decline in productivity. This method smooths out random or temporary fluctuations, helping you focus on long-term progress.
Instead of relying on arbitrary or static goals, the Moving Average uses the team’s actual recent performance to guide future targets. This encourages steady improvement while avoiding the distortion caused by one-off spikes or dips (such as urgent bug fixes, or team absences). As a result, expectations remain realistic and motivating rather than frustrating.

By setting targets as a percentage of the Moving Average, you can assess whether the trend of improvement or decline is being maintained over time. This enables you to evaluate the effectiveness of various initiatives, such as training programs, marketing campaigns, or improvements in your products and services.
It is important to note that relying solely on one indicator may not provide a comprehensive view of your performance. Therefore, consider incorporating additional relevant metrics to track your progress and align with your goals. By utilizing a combination of KPIs and reports, you can obtain a holistic understanding of your performance and make informed decisions. Check out our KPI Examples page.
Sample Use Case: Target % of MA for Kanban Throughput per Week
Step 1: In the Data source, filter resolved issues and define the time period you wish to analyze.
Step 2: Keep the default metric selection: ‘Number of issues.’
Step 3: Display by the date filed “Resolved” and specify by week.
Step 4: Switch on the Target feature and select % of Avg. target type.
Step 5: Select Moving Average target result options.
Step 6: Add a target percent value.
Step 7: Under the More Settings section, turn on the Warning Threshold feature and input the target percent value. In our sample, it is 80%.
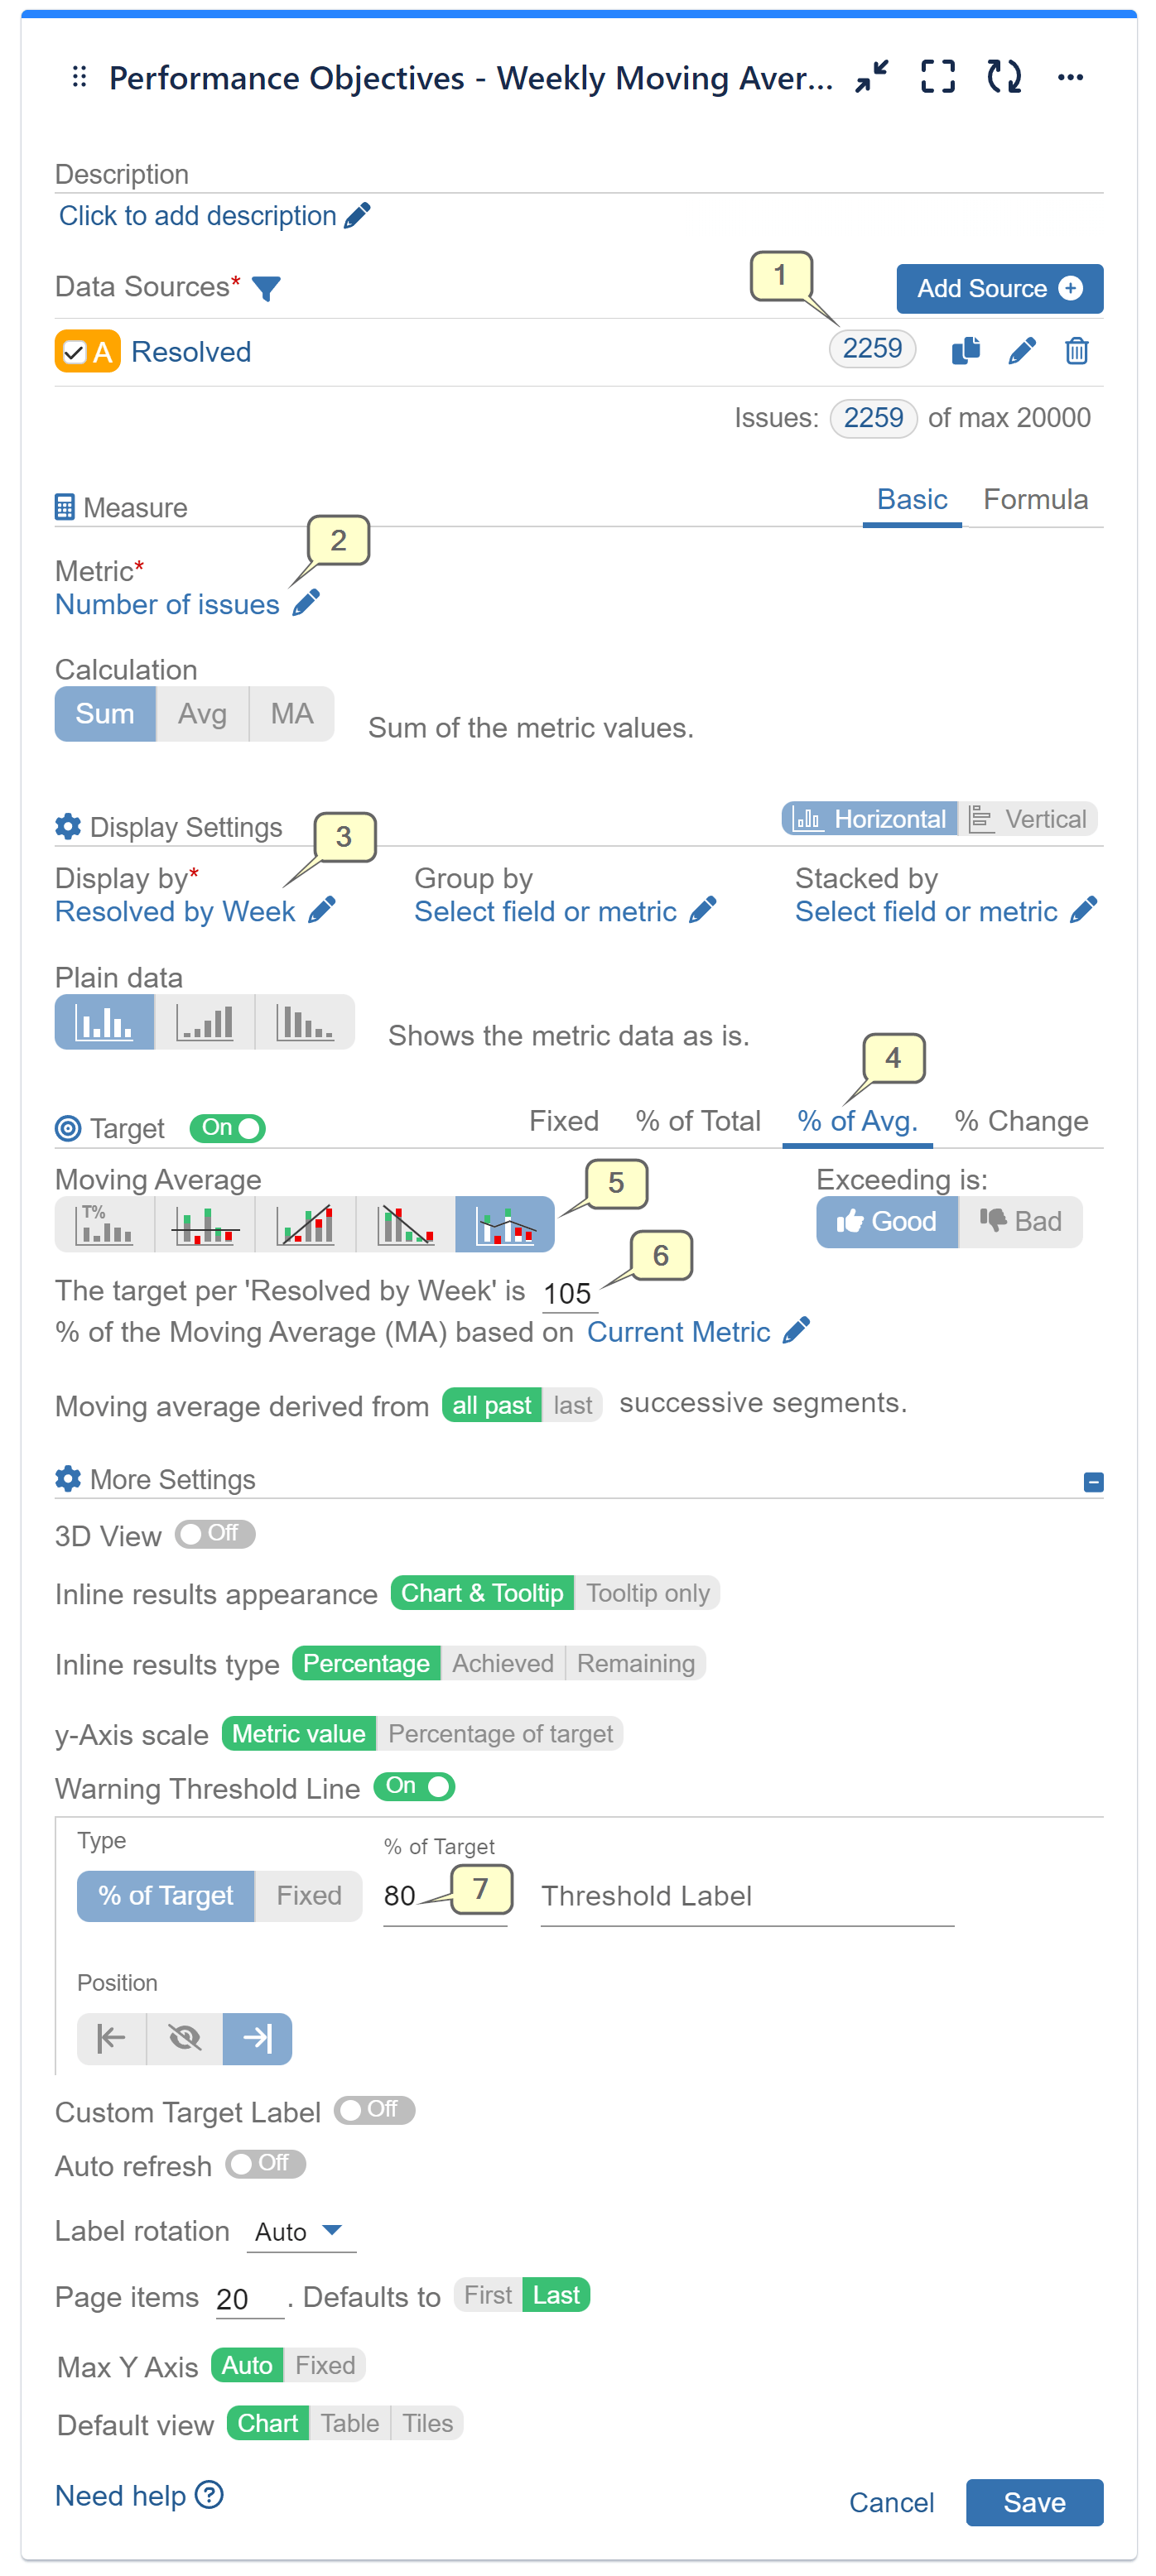
Here is the Kanban Throughput chart configured with the above settings:

Watch the recorded video demonstrating the configuration steps outlined above:
Explore more KPI examples using the Moving Average target option, like Agile Team Velocity, Personal Velocity KPI and Basic Forecasting report.
Did you know that the Performance Objectives gadget offers the ability to utilize Moving Average as a metric calculation?
If you’re looking to gain a deeper understanding this metric calculation, we invite you to explore the related article Moving Average as a metric calculation. This resource provides comprehensive insights and practical guidance on how to leverage this metric and enhance your performance analysis. It also includes a sample use case and a list of various reports that can be built using the metric.