Flow Efficiency Ratio for Jira Kanban Teams
What is Flow Efficiency? How to Measure It and Why?

How to Measure Flow Efficiency in Jira (Without Atlassian Analytics)
Jira Software’s built-in Kanban reports don’t provide Flow Efficiency as a standalone metric. To monitor this within Atlassian’s tools, you currently need Atlassian Analytics, which is only available on Enterprise plans and includes Flow Efficiency as part of its standard Flow Metrics dashboard. Atlassian defines this metric as ‘the proportion of time that work items are active against their total cycle time‘
If you’re on Jira Standard or Premium plan, the Performance Objectives app allows you to calculate Flow Efficiency Ratio directly on your Jira dashboard. It also offers additional options to customize the calculation:
- Define total time: choose whether to base your ratio on Lead Time (end-to-end) or Cycle Time (internal efficiency).
- Filter your data: If using Lead Time, you can exclude items that might distort the results, such as low-priority backlog items, Epics, or other context-specific cases. If opting for Cycle Time, select your start point – e.g., Selected for Development or In Progress.
- Select the metric: Use ‘Time in Status’ or ‘Time Between’, depending on how you want to count reopened items. In processes with frequent re-openings, ‘Time Between’ can differ significantly from ‘Time in Status’, as it will count time from creation until last resolution.
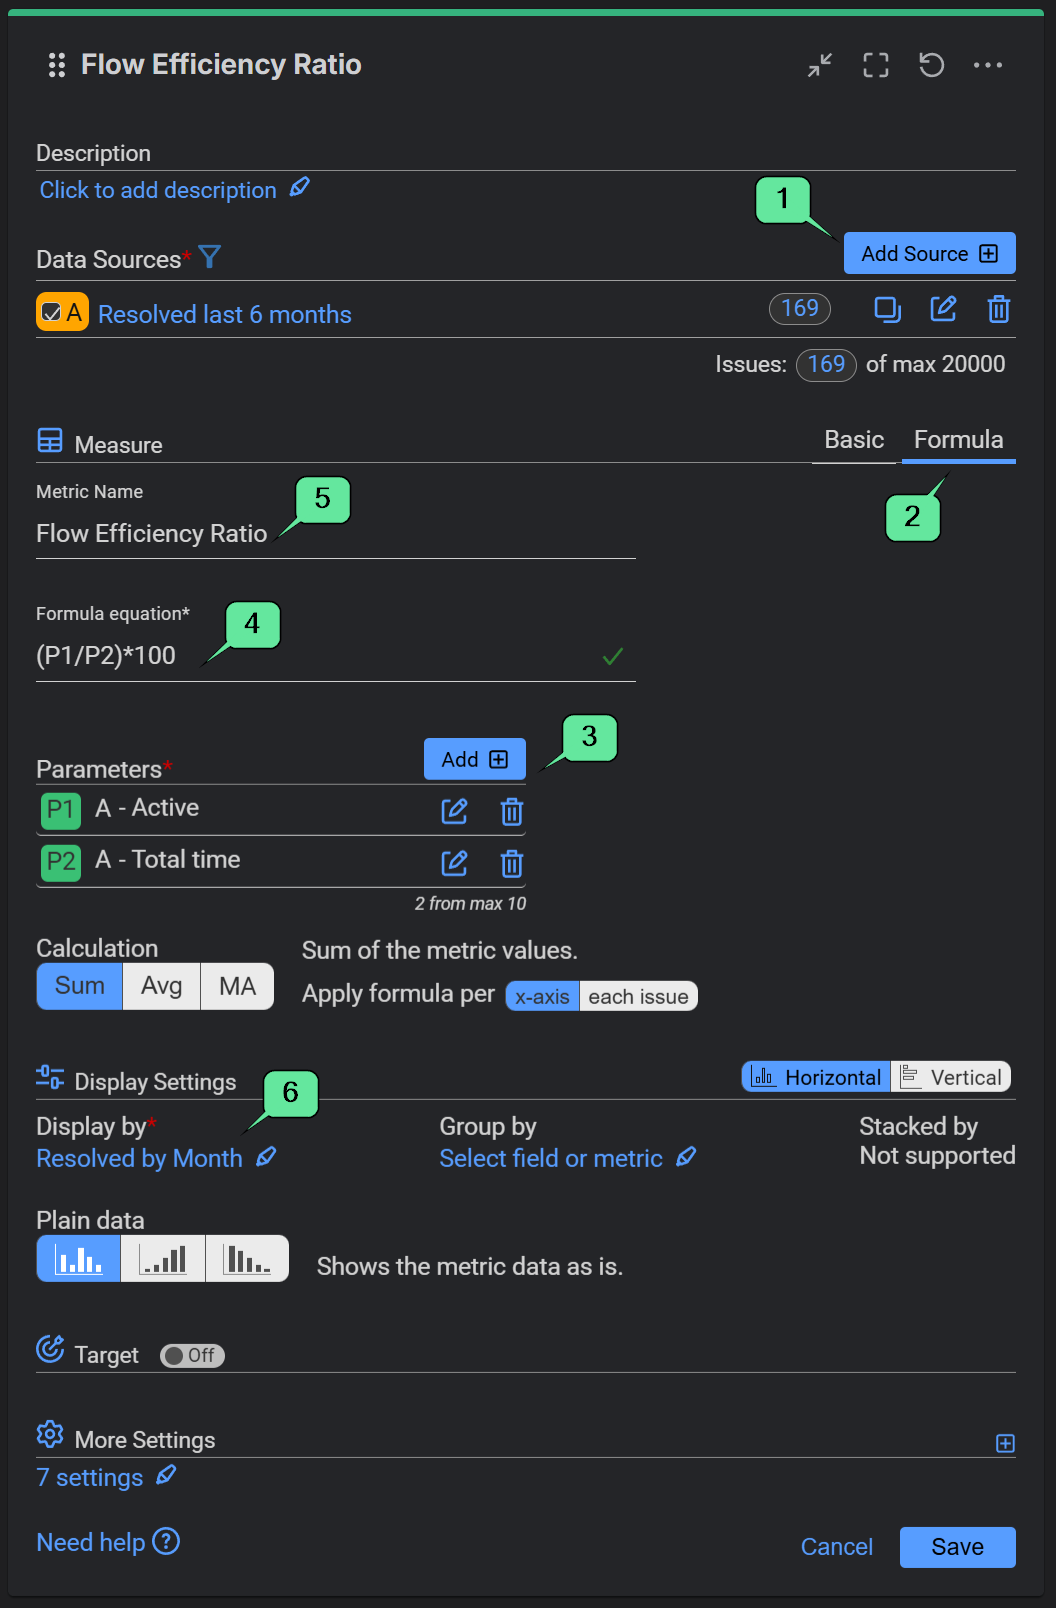
Configuring a Flow Efficiency Ratio Report in Jira with Performance Objectives App
Among its reporting capabilities, the Performance Objectives app includes a Formula feature, which lets you calculate custom ratios directly on your Jira dashboards. In this example, for Total time we’re using Lead Time (from Created to Resolved), but the app also lets you customize Flow Efficiency to your specific context and needs. You can calculate based on Cycle Time, following the Atlassian Analytics’ approach, filter out low-priority backlog items, or handle other complex scenarios.

In our sample configuration, we define Active Time using the Time in Status metric, selecting statuses mapped to the ‘In Progress’ category (In Progress, In Review, In QA). For the Total Time parameter, we use Lead Time and the Time Between metric, measuring the total duration from ‘Created’ to ‘Resolved’, to ensure the ratio accurately captures the end-to-end lifecycle of a work item.


Other Essential Metrics for Jira Kanban Reporting
This report helps you identify how efficiently work moves through the workflow. However, it is more effective when analyzed alongside other essential Kanban metrics that Jira teams rely on, such as:
- Cycle and Lead time
- Throughput
- Work in Progress (WIP)
With the Performance Objectives app, you can configure KPI reports such as Cycle Time KPI, Lead vs. Cycle Time, and Kanban Throughput report, helping you turn metrics into actionable insights. Explore our KPI examples we’ve prepared to inspire you for your next Jira dashboard, or check this blog article to see other Must-Have Kanban Reports for Jira.