Agile Team Velocity
Even though there is a popular misconception that Agile teams do not plan their work ahead, team velocity remains a foundational Agile metric essential for estimation and planning in upcoming sprints. The Performance Objectives app can help you improve velocity-based sprint planning with its dynamic sprint related fields and advanced filtering options that provide accurate velocity reporting.
Below are several features designed to enhance your sprint reporting in Jira:

The advanced filtering options for ‘Story points’ and ‘Number of issues in sprint’ metrics allow filtering by commitment, completion, rolling status, or scope change. Advanced filtering for the ‘Sprint’ field lets you segment sprint data and also choose whether to include a specific number of past sprints, the active sprint, or backlog items in your analysis. Group or stack by sprint state fields for deeper insight. Learn more at our Guide to Building Advanced Sprint Reports for Jira.
Moreover, Performance Objectives and Performance Trend gadgets enable target calculations directly on your dashboard, making performance management in Jira accessible and straightforward.
In this article, we will guide you on estimating your actual team velocity and setting targets for story points completed in a sprint based on the moving average of story points accomplished in previous sprints.
Track Actual Team Velocity in Jira with Issues Resolved in Sprint
This report allows you get a clear understanding of your actual team velocity per sprint. Transparency is key for accurate forecasting and planning of future sprints, as historical data on completed issues guides teams in setting realistic goals and optimizing their workflow. ‘Completed in sprint’ filtering option promotes accountability and collaboration within the team, as the emphasis shifts to tangible outcomes rather than merely the Story points committed. By concentrating on completed issues, teams can better identify bottlenecks, allocate resources efficiently, and refine their strategies.

In our example Agile Team Velocity KPI report, we’ve enhanced the analysis by configuring the “Sprint rolling state” field within the Stack display option. This configuration provides a clear breakdown of completed in-sprint story points, categorizing them into two main segments: “new” – issues or story points initially added and completed within the current sprint, and “rolling” – issues or story points completed within the current sprint but originating from a previous one. This distinction offers a comprehensive view of issue completion dynamics within sprints. Overall, this report empowers Jira users with a practical tool to enhance productivity, refine sprint planning, and foster continuous improvement in their agile processes.
Now, let’s delve into a comprehensive step-by-step guide for creating the Actual Team Velocity report within Jira:
Step 1: Begin by disabling the Date Range in the Data source and selecting the project you wish to analyze.
Step 2: Next, choose the ‘Story Points’ metric.
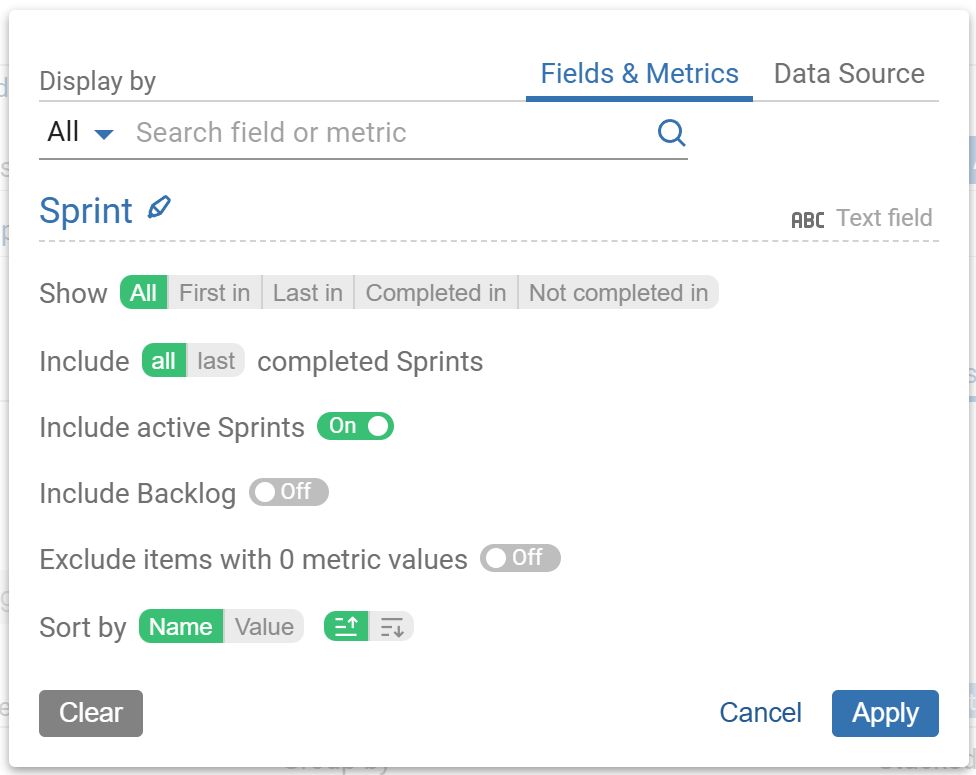
Step 3: For the x-axis, opt for ‘Sprint’ and set it under the ‘Display by’ field. To filter story points completed in the sprint, select “Completed in”.
Step 4: Whenever you opt to display results by Sprint, you’ll have to select a Sprint board to generate the report. This step is mandatory and ensures accurate sprint reporting.
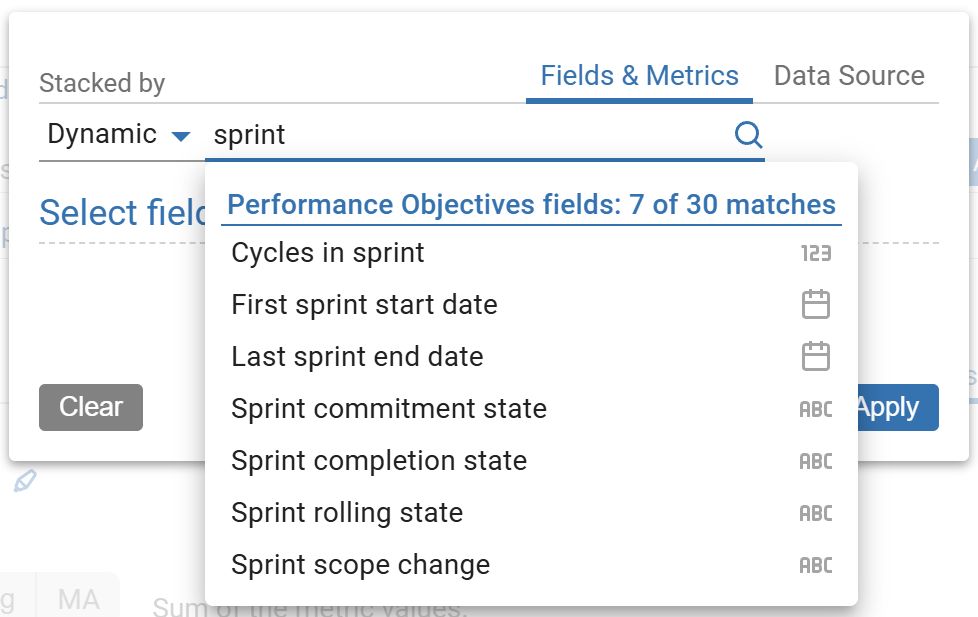
Step 5: (Optional) Stack by “Sprint rolling state” field to distinguish between story points newly added to the particular sprint and those that are rolling over from previous sprints.
The next steps are optional.
Even if you choose to skip steps 6 to 9, the chart will still display a calculated velocity per the number of sprints you’ve chosen to include.
Steps 6 to 9 are recommended for users who want to add a clear benchmark to their report, making it easier to interpret performance results directly on their Jira dashboard.
Step 6: Switch-on Target section and select ‘% of Avg’ tab.
Step 7: Evaluate Target per Sprint as Moving Average (MA) based on the current metric.
Step 8: Set a target level of your choice. In our example, we used 95% of the Moving Average derived from all past sprints, but you can limit this to a set number of recent sprints instead. Keep the ‘Exceeding is good’ selection.
Step 9: Under the ‘More Setting’ section enable and define ‘Warning threshold’. The results above the threshold and under the target level will be colored in amber on the chart.

Please refer to the following video for a detailed guide on configuring Agile Team Velocity KPI report:
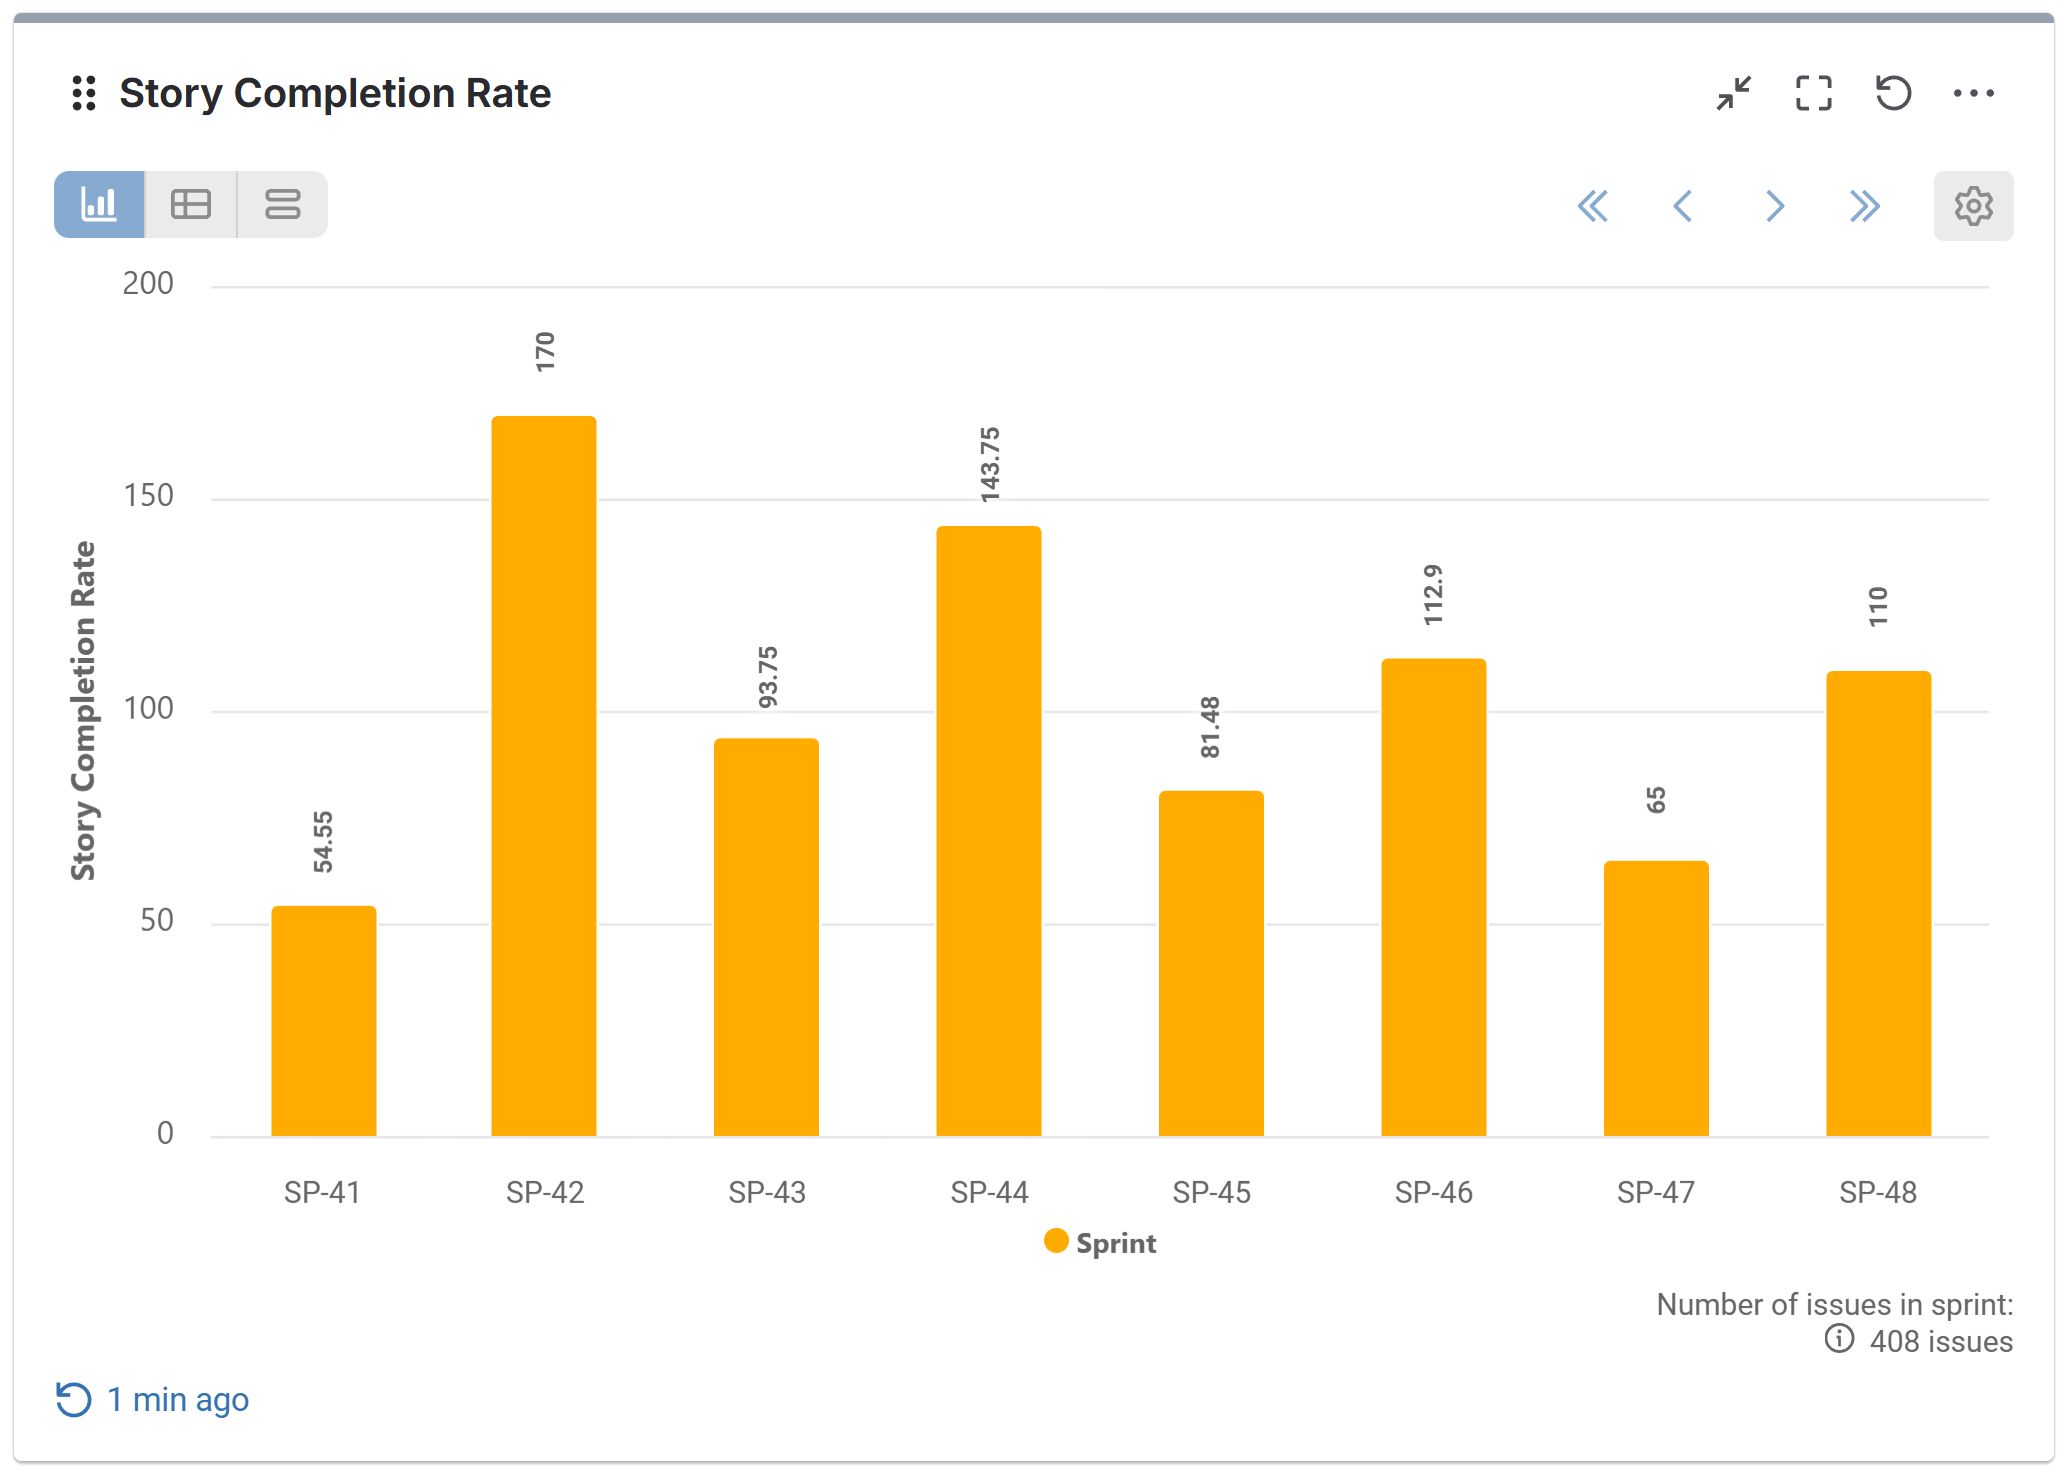
Measure Sprint Execution Accuracy with Story Completion Rate Report
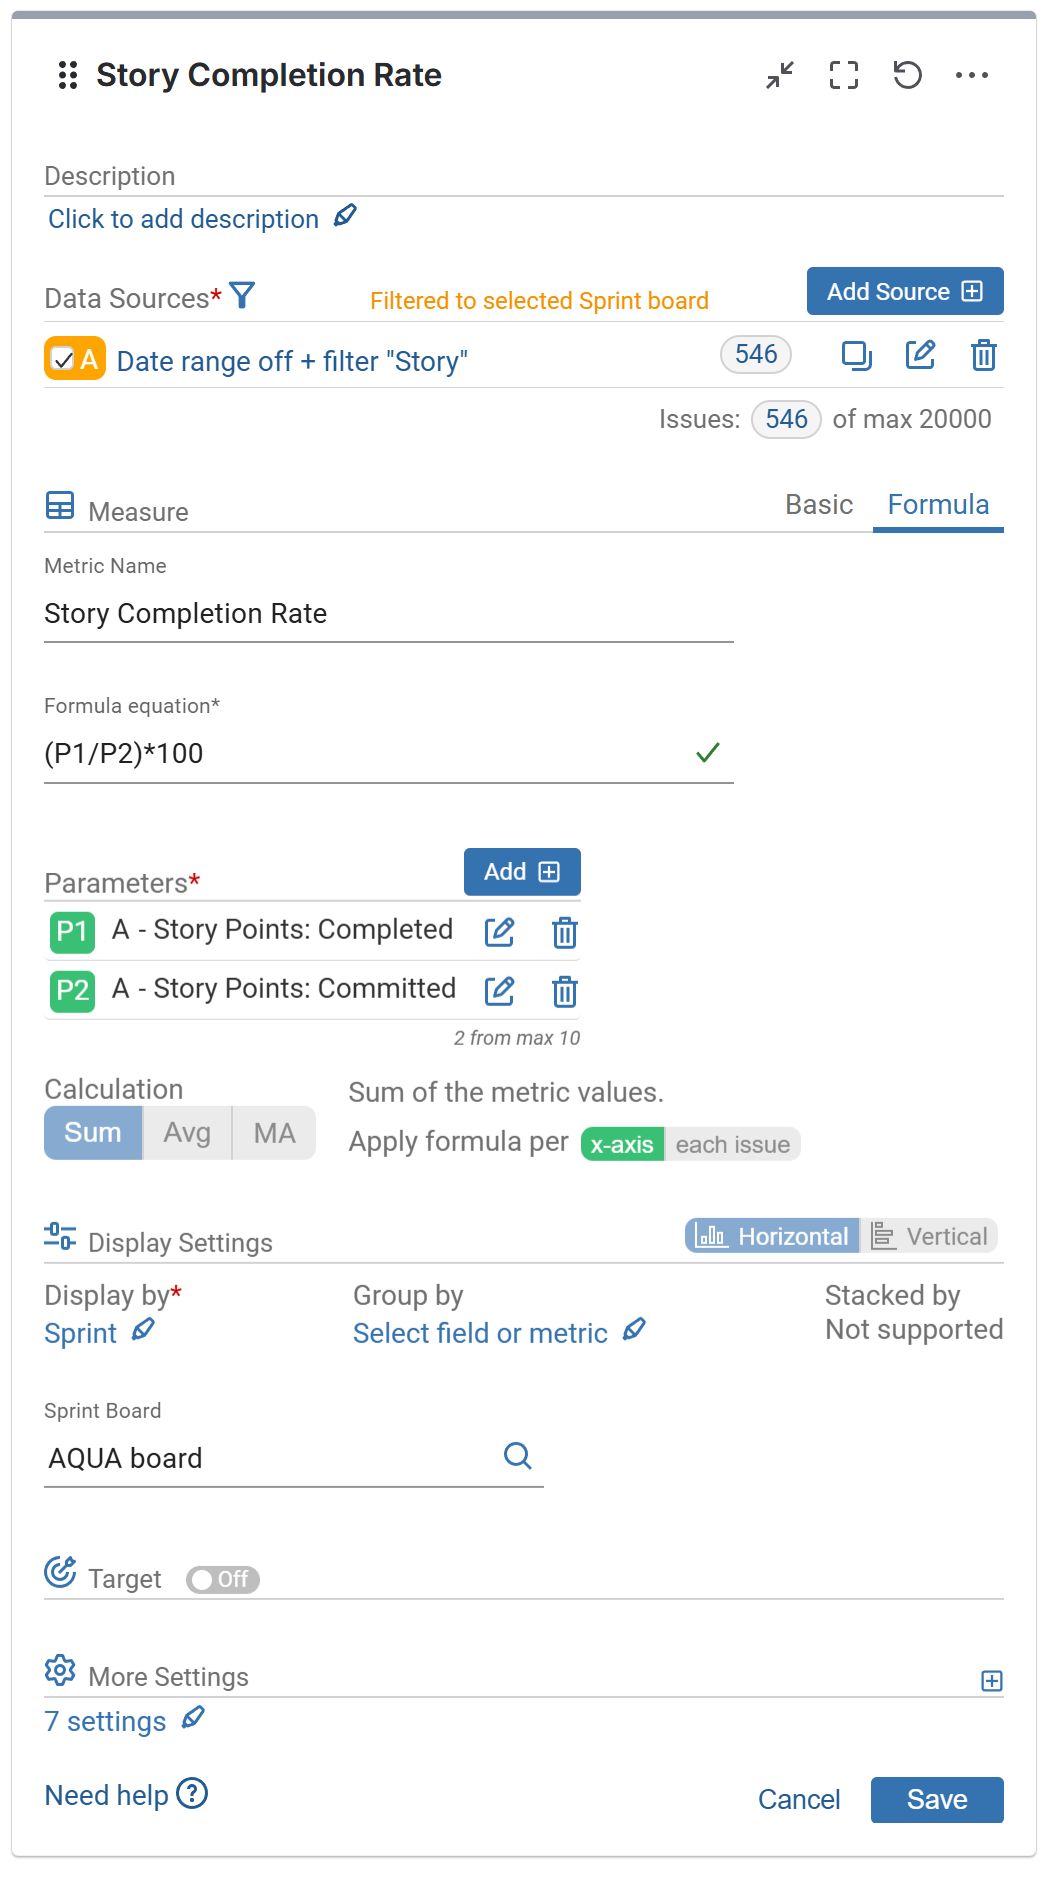
Story Completion Rate is the ratio of committed story points vs. completed story points per sprint. It answers the question: “How much of the work we committed to did we actually deliver?” Using the Performance Objectives app for Jira, you can easily build this report. First, select the data you want to analyze and filter for Stories only, especially if your team includes estimates on other issue types like Bugs. Then, use the Story points metric and the app’s rich filtering options, and apply the custom formula:
Story Completion Ratio = (Story points Completed / Story points Committed)*100.
While this may sound similar to tracking team velocity, there’s an important distinction: velocity measures the total story points completed in a sprint, helping with future capacity planning. In contrast, the Story Completion Rate focuses on how well your team delivers on what was actually agreed on, making it a good discussion point for retrospectives insights, and indicator of reliability and sprint planning accuracy.
In simple terms: velocity says: “We completed 45 story points this sprint.” While the Story Completion Rate says: “We committed to 50 story points, and delivered 45, so we completed 90% of what we agreed upon.”
Here’s a glimpse at this report and its configuration settings:
Track your team’s velocity in addition to other metrics to effectively measure their progress and performance. Explore our Use Cases and Confluence documentation to discover how our app can provide deeper insights from your Jira data.